Fig. 1.
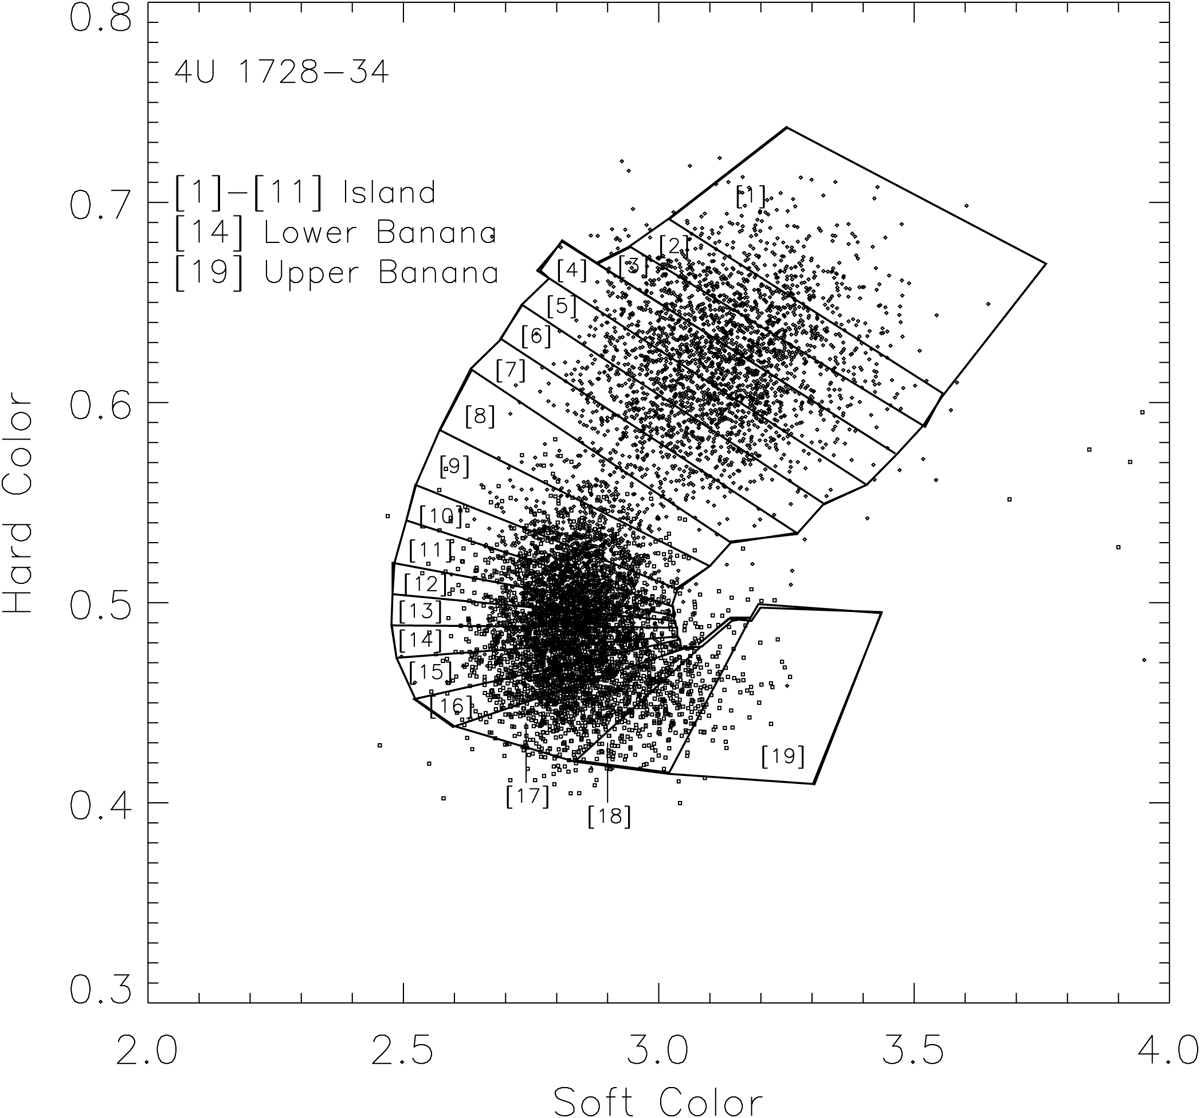
X-ray color–color diagram of 4U 1728-34, where the soft and hard colors are defined as the ratio of the count rates in the bands 3.5–6.4 keV/2.0–3.5 keV and 9.7–16 keV/6.4–9.7 keV, respectively. This labeled area of boxes indicate the intervals used to select the power spectra. The figure is reproduced with the same dataset of RXTE used by Di Salvo et al. (2001).
Current usage metrics show cumulative count of Article Views (full-text article views including HTML views, PDF and ePub downloads, according to the available data) and Abstracts Views on Vision4Press platform.
Data correspond to usage on the plateform after 2015. The current usage metrics is available 48-96 hours after online publication and is updated daily on week days.
Initial download of the metrics may take a while.