Fig. 2.
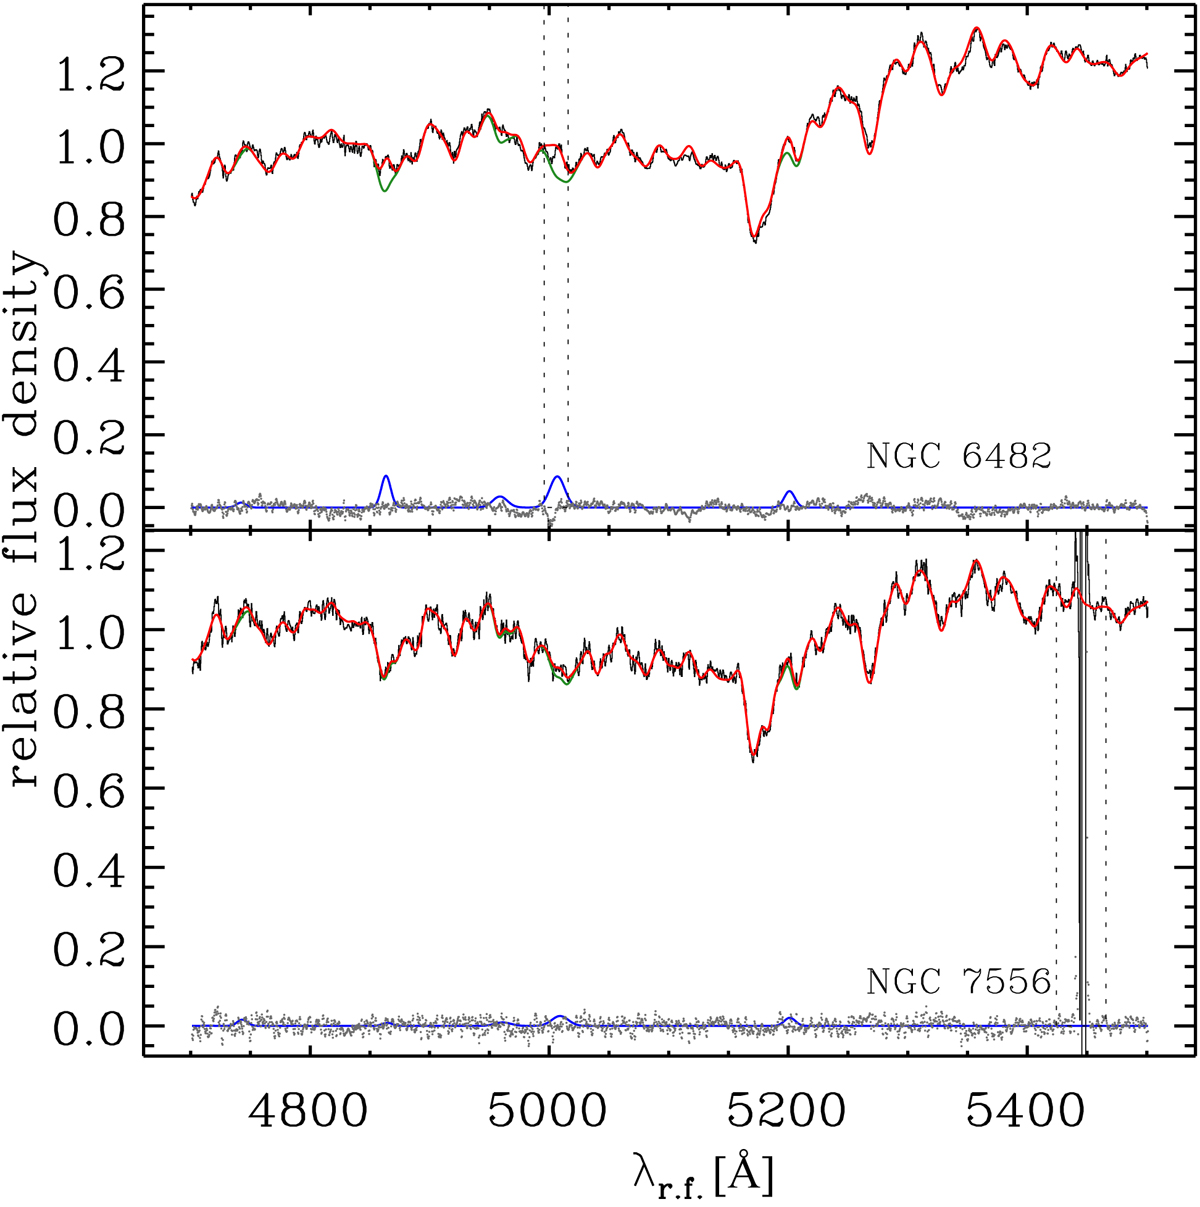
Central rest-frame spectra extracted along the major axis of NGC 6482 (top panel) and NGC 7556 (bottom panel). Relative fluxes have false zero points for viewing convenience. In each panel the best-fitting model (red line) is the sum of the spectra of the ionized-gas (blue line) and stellar component (green line). The latter is obtained convolving the synthetic templates with the best-fitting LOSVD and multiplying them by the best-fitting Legendre polynomials. The residuals (gray dots) are obtained by subtracting the model from the spectrum. The vertical lines mark the wavelength ranges excluded from the fit.
Current usage metrics show cumulative count of Article Views (full-text article views including HTML views, PDF and ePub downloads, according to the available data) and Abstracts Views on Vision4Press platform.
Data correspond to usage on the plateform after 2015. The current usage metrics is available 48-96 hours after online publication and is updated daily on week days.
Initial download of the metrics may take a while.