Fig. B.3.
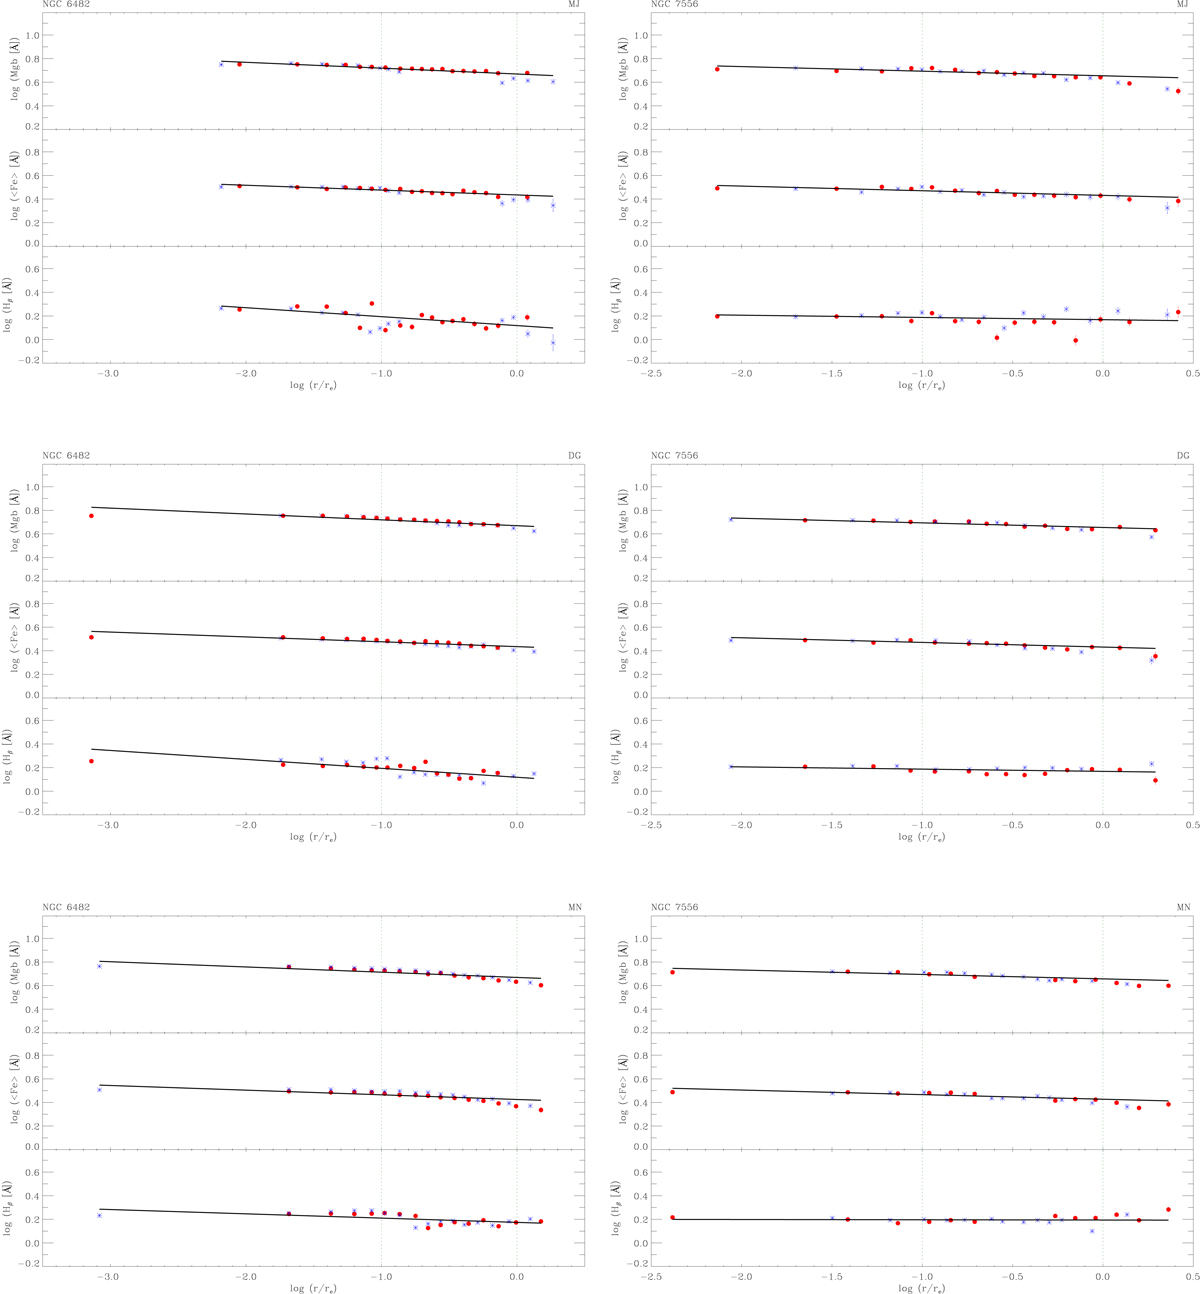
Gradients of the line-strength indices Hβ, 〈Fe〉, and Mgb measured along the major (top panels), diagonal (middle panels), and minor axis (bottom panels) of NGC 6482 (left panels) and NGC 7556 (right panels). For each axis, the curves are folded around the nucleus. Blue asterisks and red circles refer to data measured along the approaching and residing sides of the galaxy, respectively. The solid line corresponds to the best-fitting power law to the available data, while the vertical dotted lines mark the radial range between 0.1re and re of the spheroidal component. The name of the galaxy and orientation of the slit are given for each data set.
Current usage metrics show cumulative count of Article Views (full-text article views including HTML views, PDF and ePub downloads, according to the available data) and Abstracts Views on Vision4Press platform.
Data correspond to usage on the plateform after 2015. The current usage metrics is available 48-96 hours after online publication and is updated daily on week days.
Initial download of the metrics may take a while.