Fig. 1.
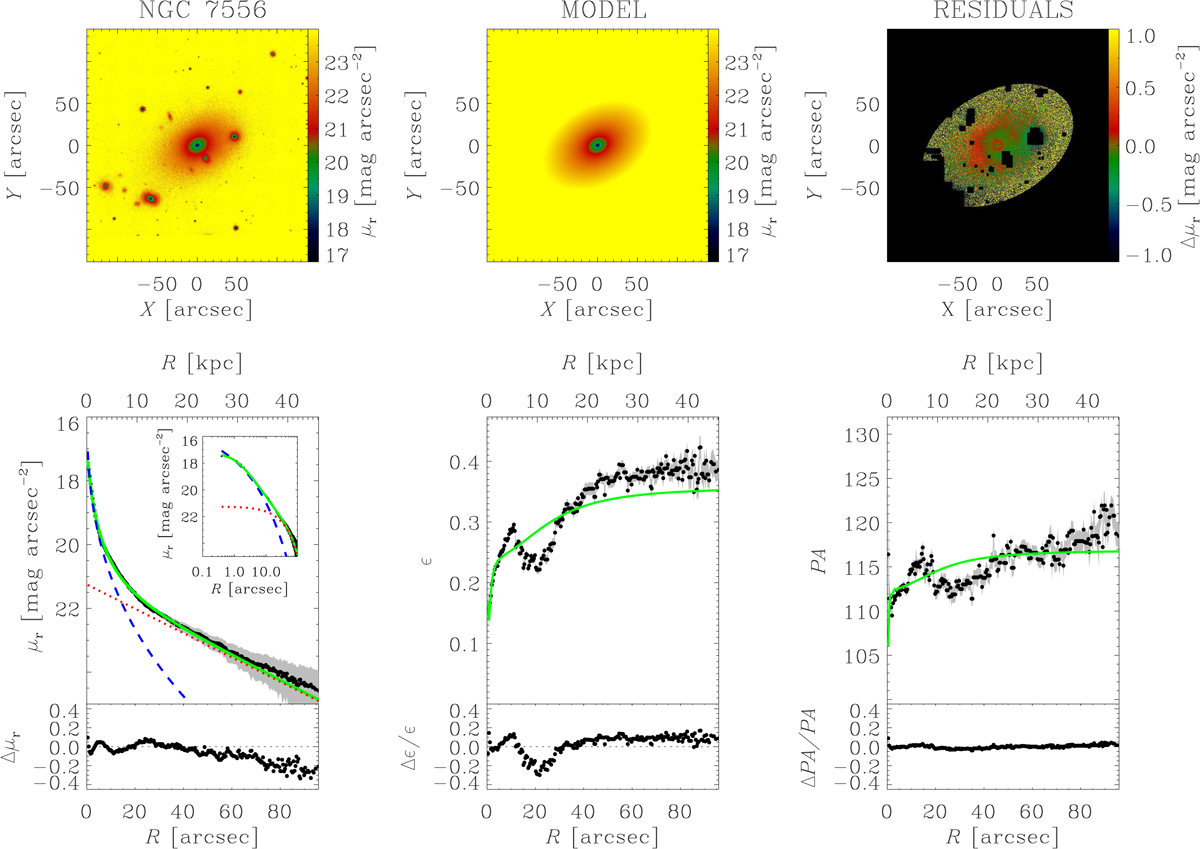
Two-dimensional photometric decomposition of the r-band image of the NGC 7556. The upper panels (from left to right) show the map of the observed, modeled, and residual (observed−modeled) surface brightness distributions. The field of view is oriented with North up and East left. The black areas in the residual image correspond to pixels excluded from the fit. The lower panels (from left to right) show the ellipse-averaged radial profile of surface brightness, position angle, and ellipticity measured in the observed (black dots with gray error bars) and seeing-convolved modeled image (green solid line) and their corresponding difference. The intrinsic surface-brightness radial profiles of the best-fitting spheroid (blue dashed line) and halo (red dotted line) components are also shown in both linear and logarithmic scale for the distance to the center of the galaxy.
Current usage metrics show cumulative count of Article Views (full-text article views including HTML views, PDF and ePub downloads, according to the available data) and Abstracts Views on Vision4Press platform.
Data correspond to usage on the plateform after 2015. The current usage metrics is available 48-96 hours after online publication and is updated daily on week days.
Initial download of the metrics may take a while.