Fig. 4.
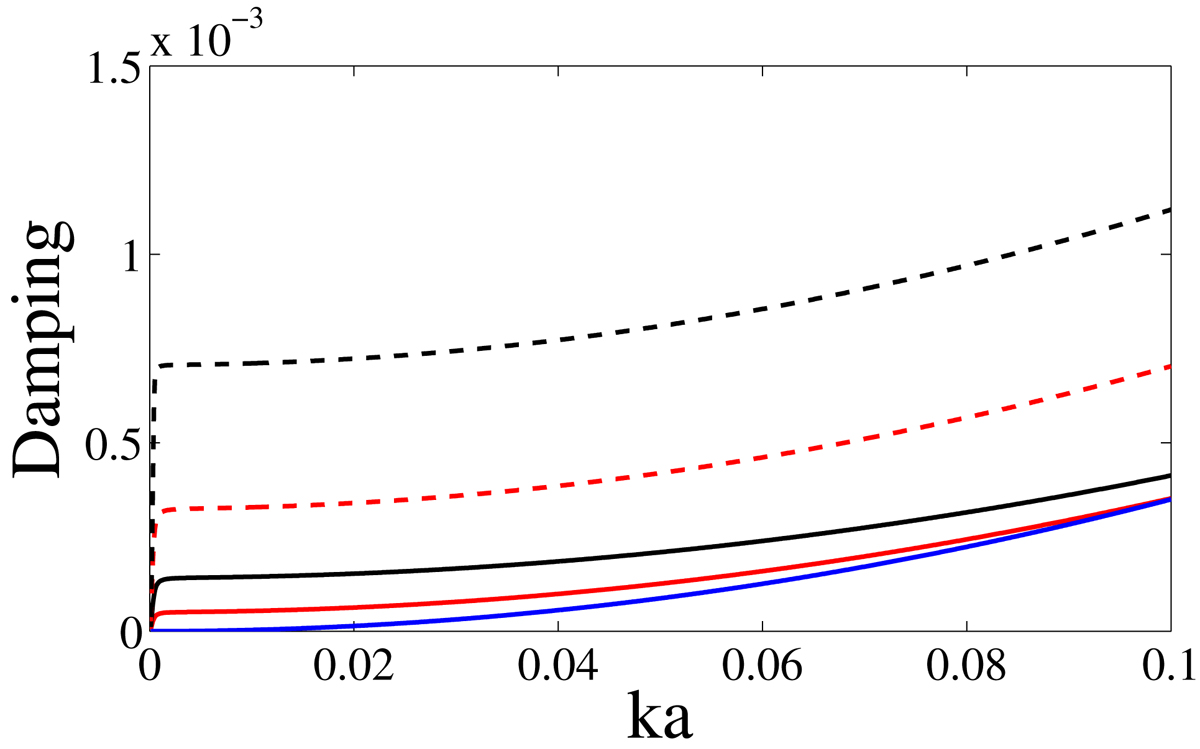
Damping of the torsional wave normalised by the Alfvén wave frequency versus the longitudinal wave number for coronal conditions where we have the normalised viscosity ν/(RSunCA)=10−5, the gravity g = 274 m s−2, the local Alfvén speed CA = 1000 km s−1, and the plasma-β = 0.1. The red and black solid lines are for when the plasma structure is only rotating with values equal to 0.1 and 0.2, respectively, while the red and black dashed lines are for when the tube is only twisted with respective values of 0.1 and 0.2. The blue curve is for an untwisted and non-rotating flux tube. The plots have been obtained using the analytic expression represented by Eq. (20).
Current usage metrics show cumulative count of Article Views (full-text article views including HTML views, PDF and ePub downloads, according to the available data) and Abstracts Views on Vision4Press platform.
Data correspond to usage on the plateform after 2015. The current usage metrics is available 48-96 hours after online publication and is updated daily on week days.
Initial download of the metrics may take a while.