Fig. 2.
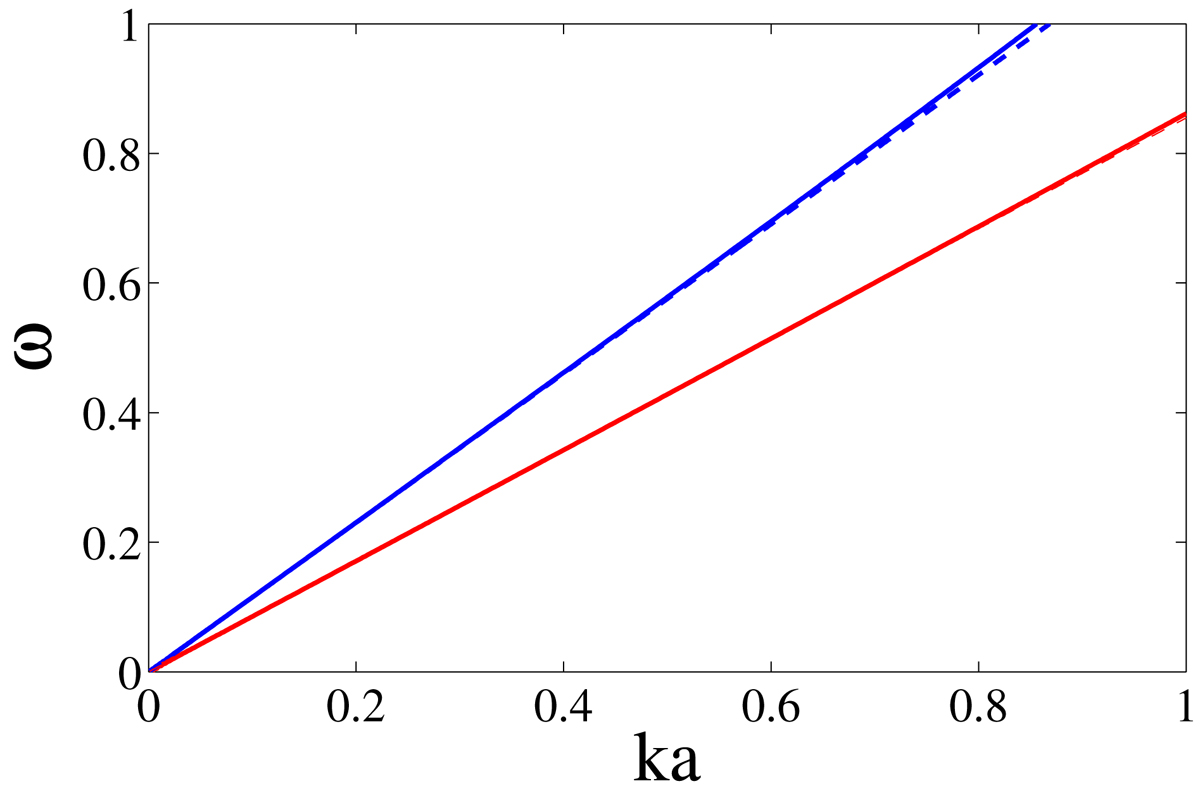
Frequency of the torsional wave (normalised by the Alfvén wave frequency) versus the longitudinal wave number for typical parameters of a solar plasma structure. The solid lines are obtained numerically from Eq. (19) while the dashed lines are plotted from the analytic expression represented by Eq. (20). For the blue lines we have 𝒦 = 0.4, ℛ = 0.1, while for the red lines we have 𝒦 = 0.1, ℛ = 0.4.
Current usage metrics show cumulative count of Article Views (full-text article views including HTML views, PDF and ePub downloads, according to the available data) and Abstracts Views on Vision4Press platform.
Data correspond to usage on the plateform after 2015. The current usage metrics is available 48-96 hours after online publication and is updated daily on week days.
Initial download of the metrics may take a while.