Fig. 4.
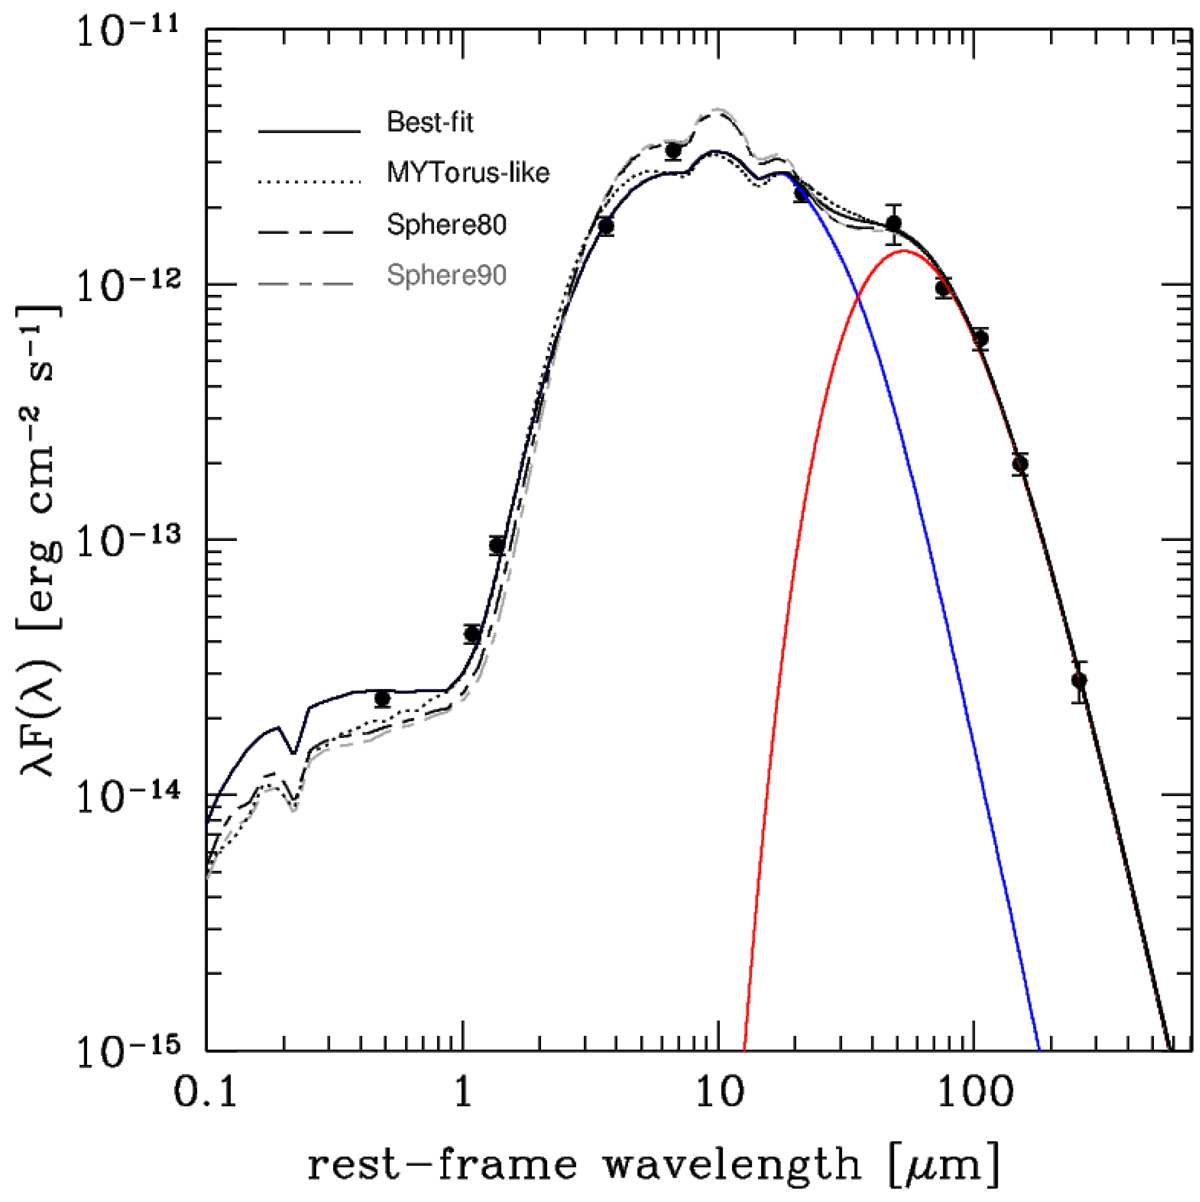
SED modeling for W1835. The solid line reports the best-fit model (black, red, and blue represent the total, AGN-only, and modified blackbody components). Dotted and dashed lines represent best-fit models assuming a toroidal geometry similar to the MYTOR and BNSPHERE (black and gray show 80 deg and 90 deg inclination angles) models used for the X-ray analysis (Sect. 3.2). See Sect. 4 and Table 3 for further details.
Current usage metrics show cumulative count of Article Views (full-text article views including HTML views, PDF and ePub downloads, according to the available data) and Abstracts Views on Vision4Press platform.
Data correspond to usage on the plateform after 2015. The current usage metrics is available 48-96 hours after online publication and is updated daily on week days.
Initial download of the metrics may take a while.