Free Access
Fig. 9
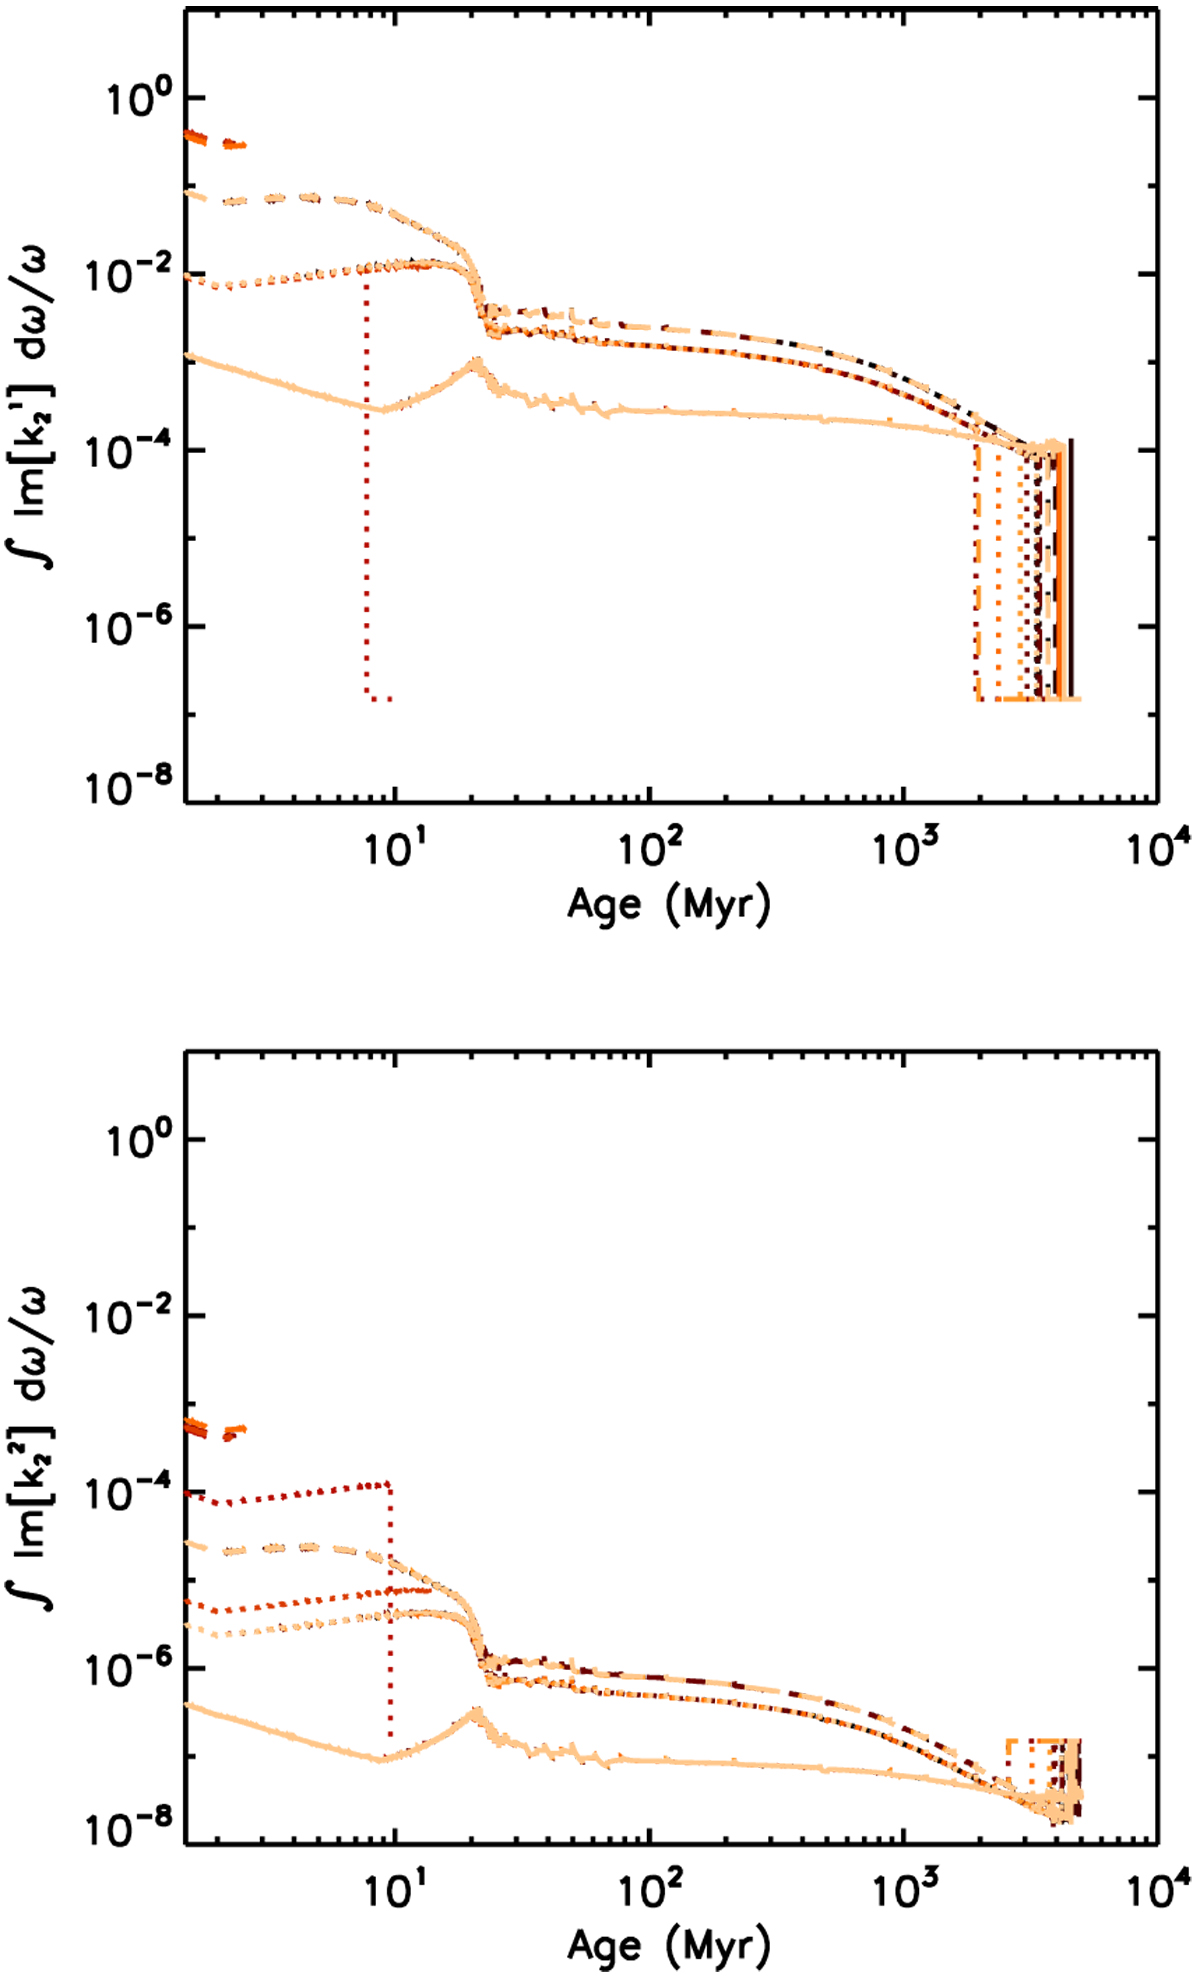
Same as Fig. 7 but for a 1.2 M⊙ mass host. The line styles and colours correspond to those of the tracks shown in Fig. 8. The dissipation starts with the value expected from the dissipation of inertial waves and assumes the equilibrium tide constant Q′ value only after the first Gyr for most orbital configurations.
Current usage metrics show cumulative count of Article Views (full-text article views including HTML views, PDF and ePub downloads, according to the available data) and Abstracts Views on Vision4Press platform.
Data correspond to usage on the plateform after 2015. The current usage metrics is available 48-96 hours after online publication and is updated daily on week days.
Initial download of the metrics may take a while.