Fig. 6
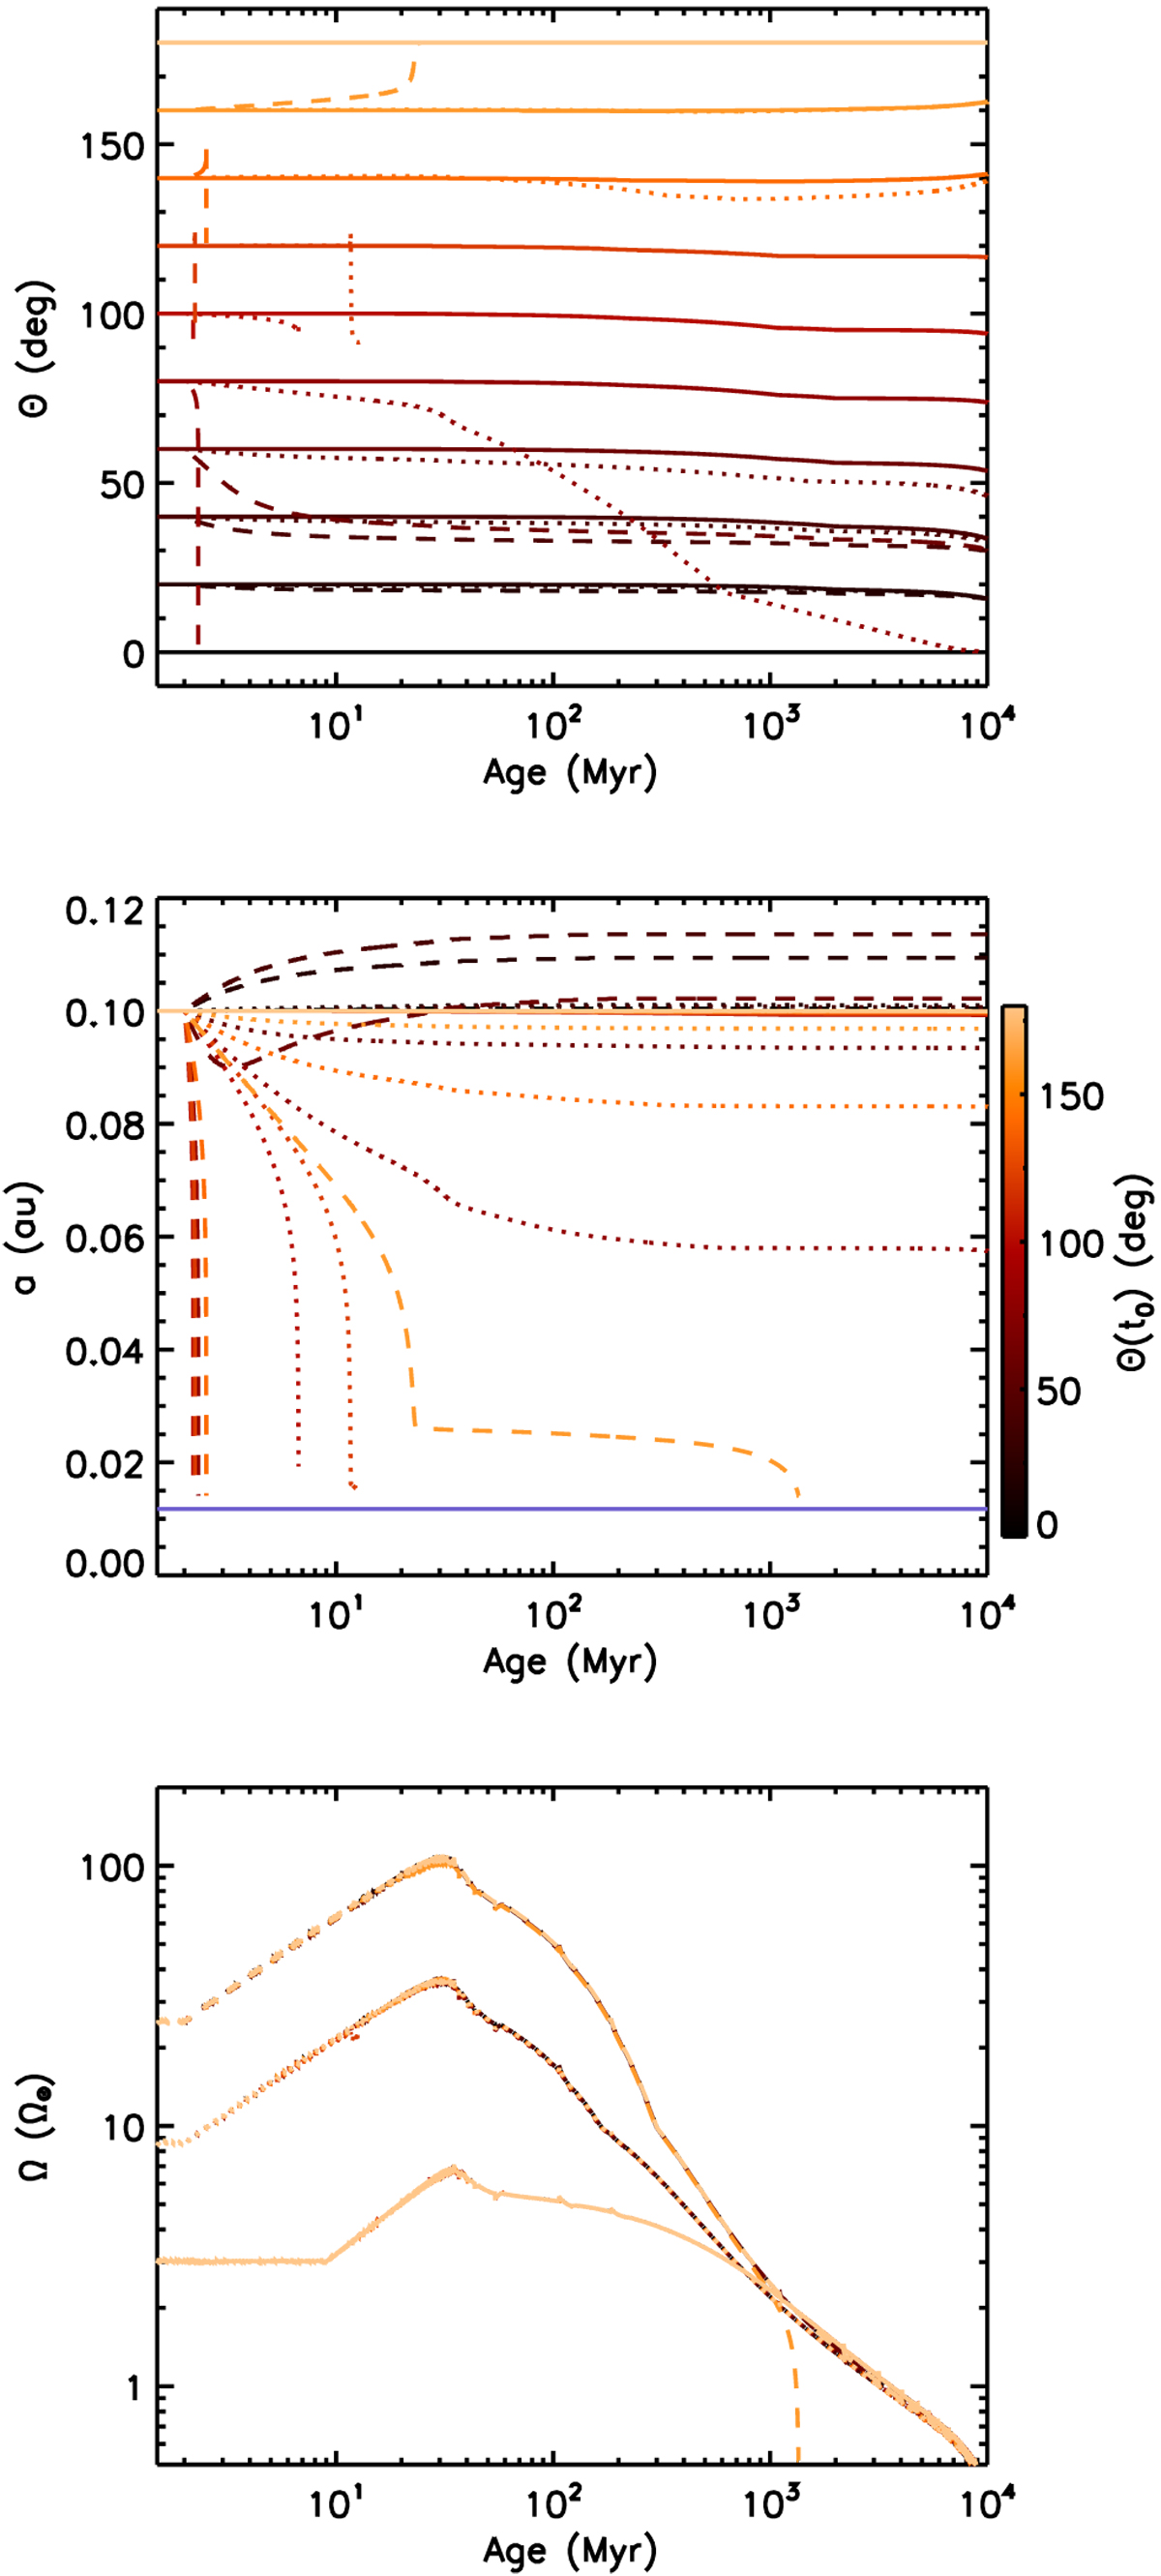
Temporal evolution of the obliquity (top panel), semi-major axis (middle panel), and rotation frequency of the envelope (bottom panel) for a 1MJup planet orbiting a 1 M⊙ star starting at a(t0) = 0.1 AU. The line colours indicate the value of the initial obliquity as indicated on the colour scale in the middle panel. The solid, dotted, and dashed lines correspond to a star initially rotating with Ω (t0) = 3, 8.5, and 25Ω⊙, respectively.The solid blue line in the middle panel indicates the Roche limit, where our evolution is stopped.
Current usage metrics show cumulative count of Article Views (full-text article views including HTML views, PDF and ePub downloads, according to the available data) and Abstracts Views on Vision4Press platform.
Data correspond to usage on the plateform after 2015. The current usage metrics is available 48-96 hours after online publication and is updated daily on week days.
Initial download of the metrics may take a while.