Fig. 3.
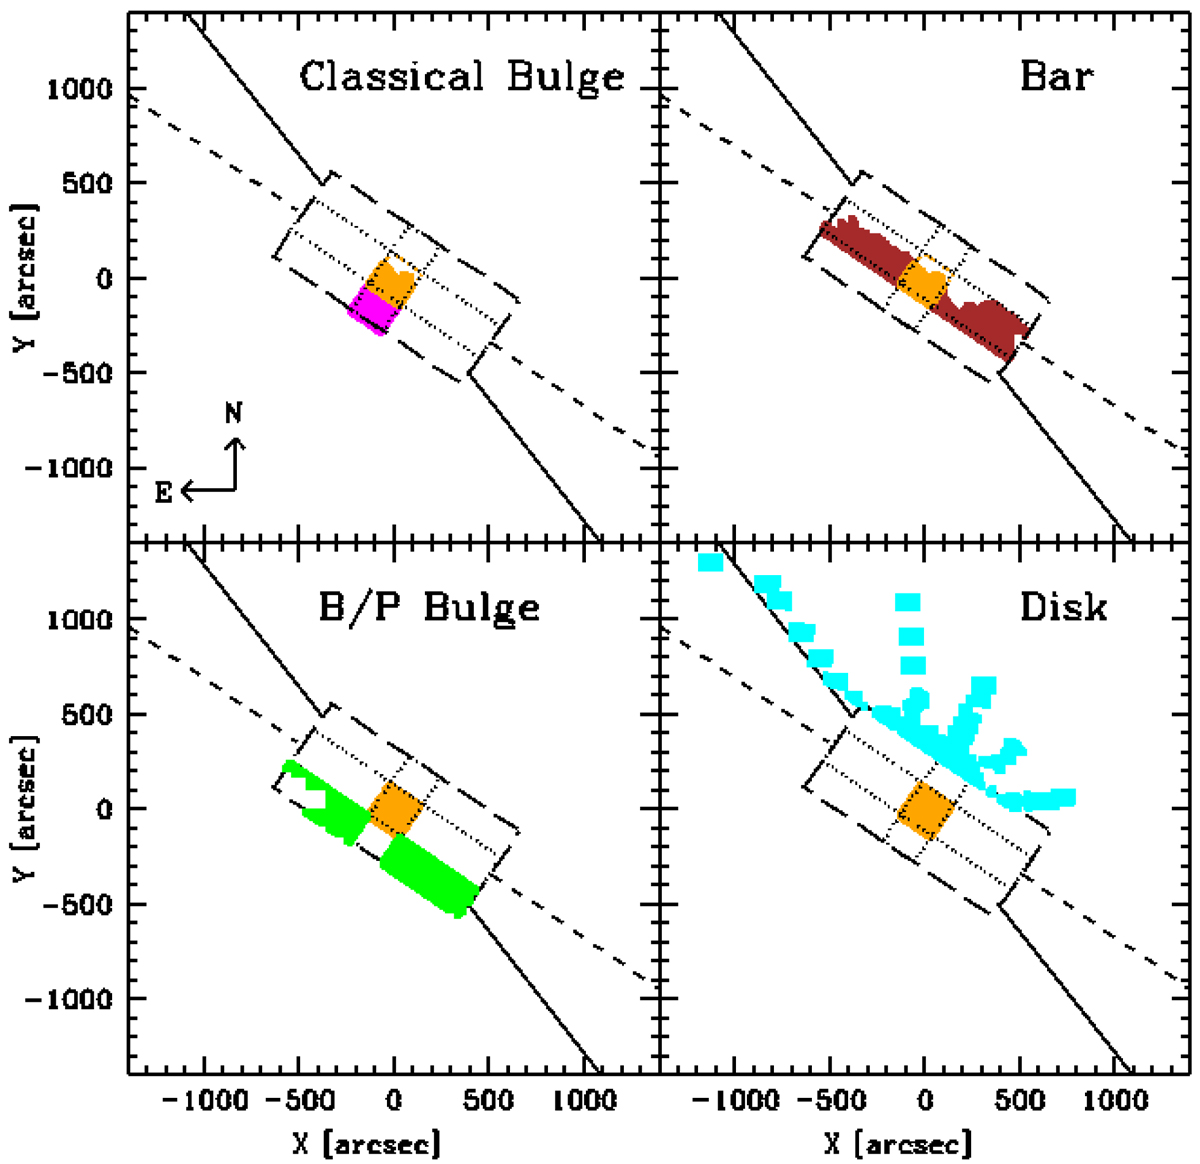
Schematic definition of the various regions of M 31 discussed in Sect. 2. The different colors show the points used in the derivation of Figs. 21–24. The inner (100 arcsec) region of the CB is indicated in orange, the outer region perpendicular to the bar in magenta. The bar region outside the CB is represented in brown, the B/P region in green, and the disk in cyan. North is to the top, east to the left.
Current usage metrics show cumulative count of Article Views (full-text article views including HTML views, PDF and ePub downloads, according to the available data) and Abstracts Views on Vision4Press platform.
Data correspond to usage on the plateform after 2015. The current usage metrics is available 48-96 hours after online publication and is updated daily on week days.
Initial download of the metrics may take a while.