Fig. 21.
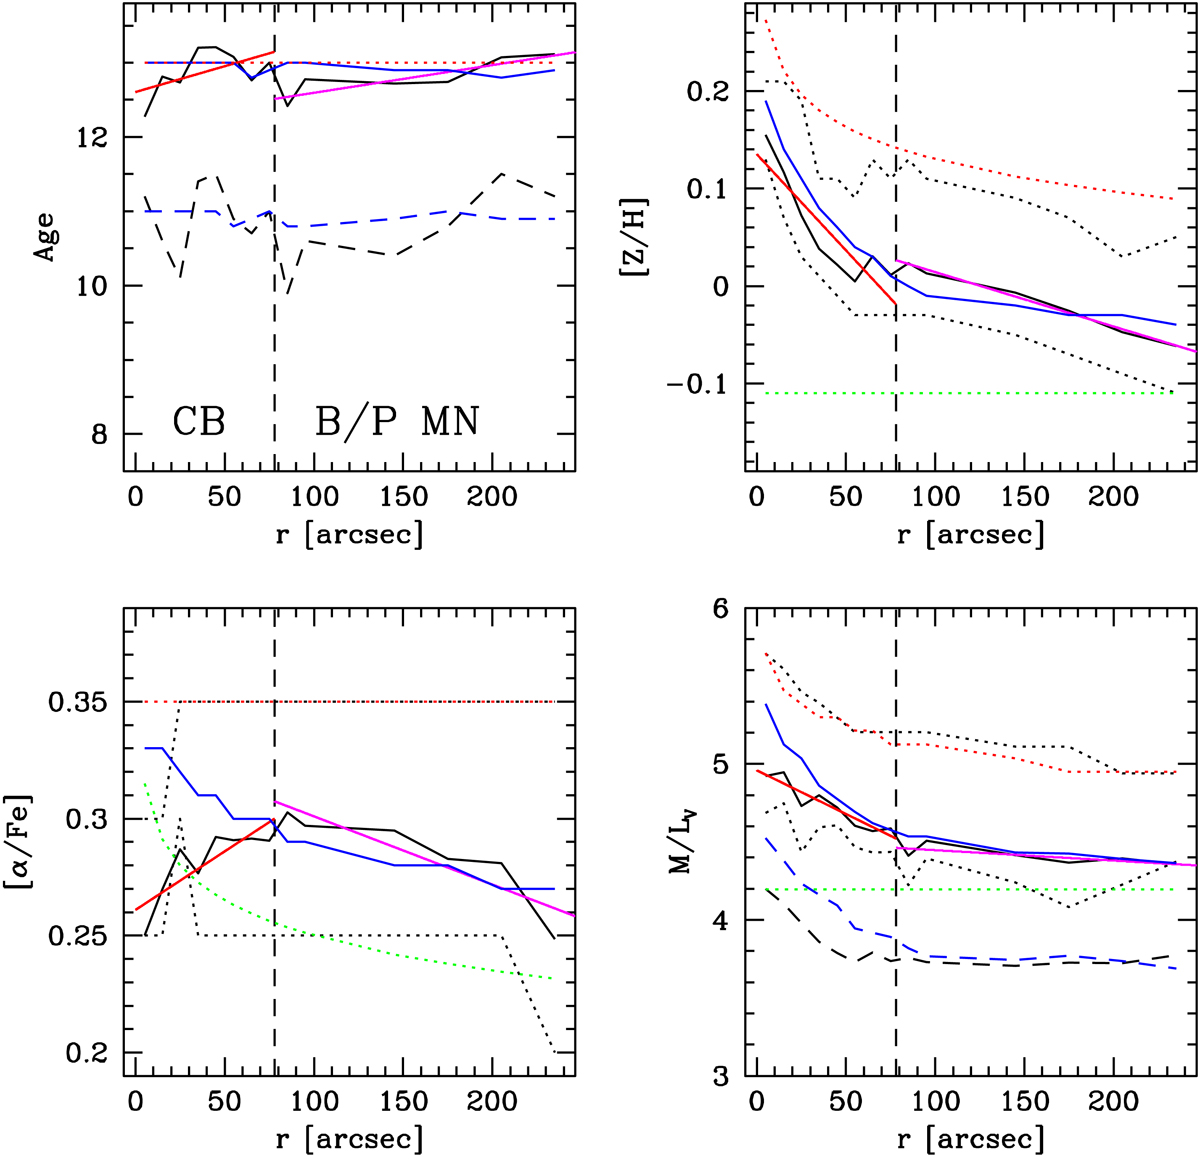
Average (over regions 10 arcsec wide in the inner 100 arcsec, 30 arcsec wide at larger distance) age, metallicity, [α/Fe], and M/LV profiles along the bar minor axis of M 31 (black full lines) tracing the CB component of M 31 (see Fig. 3). The black dashed line in the M/LV plot shows the average (over the same regions) of the M/LV 20% values. The black dashed line in the age plot shows the 20% percentile of the distribution of values in the bins; the black dotted lines in the other plots show the 34 and 84 percentile of the distributions of values in the bins. The straight lines (red for the inner bulge, magenta for the outer bulge; see Fig. 3) show the fitted gradients (see Table 2). The blue lines show the composite stellar population model according to Eq. (6) and Table 4, the dotted red and green lines the assumed profiles for the CB and B/P components, respectively. The blue dashed lines show the age and M/LV profiles obtained using the age values denoted with “20%” in Table 4. The vertical dashed line indicates 0.13rbar.
Current usage metrics show cumulative count of Article Views (full-text article views including HTML views, PDF and ePub downloads, according to the available data) and Abstracts Views on Vision4Press platform.
Data correspond to usage on the plateform after 2015. The current usage metrics is available 48-96 hours after online publication and is updated daily on week days.
Initial download of the metrics may take a while.