Fig. 1.
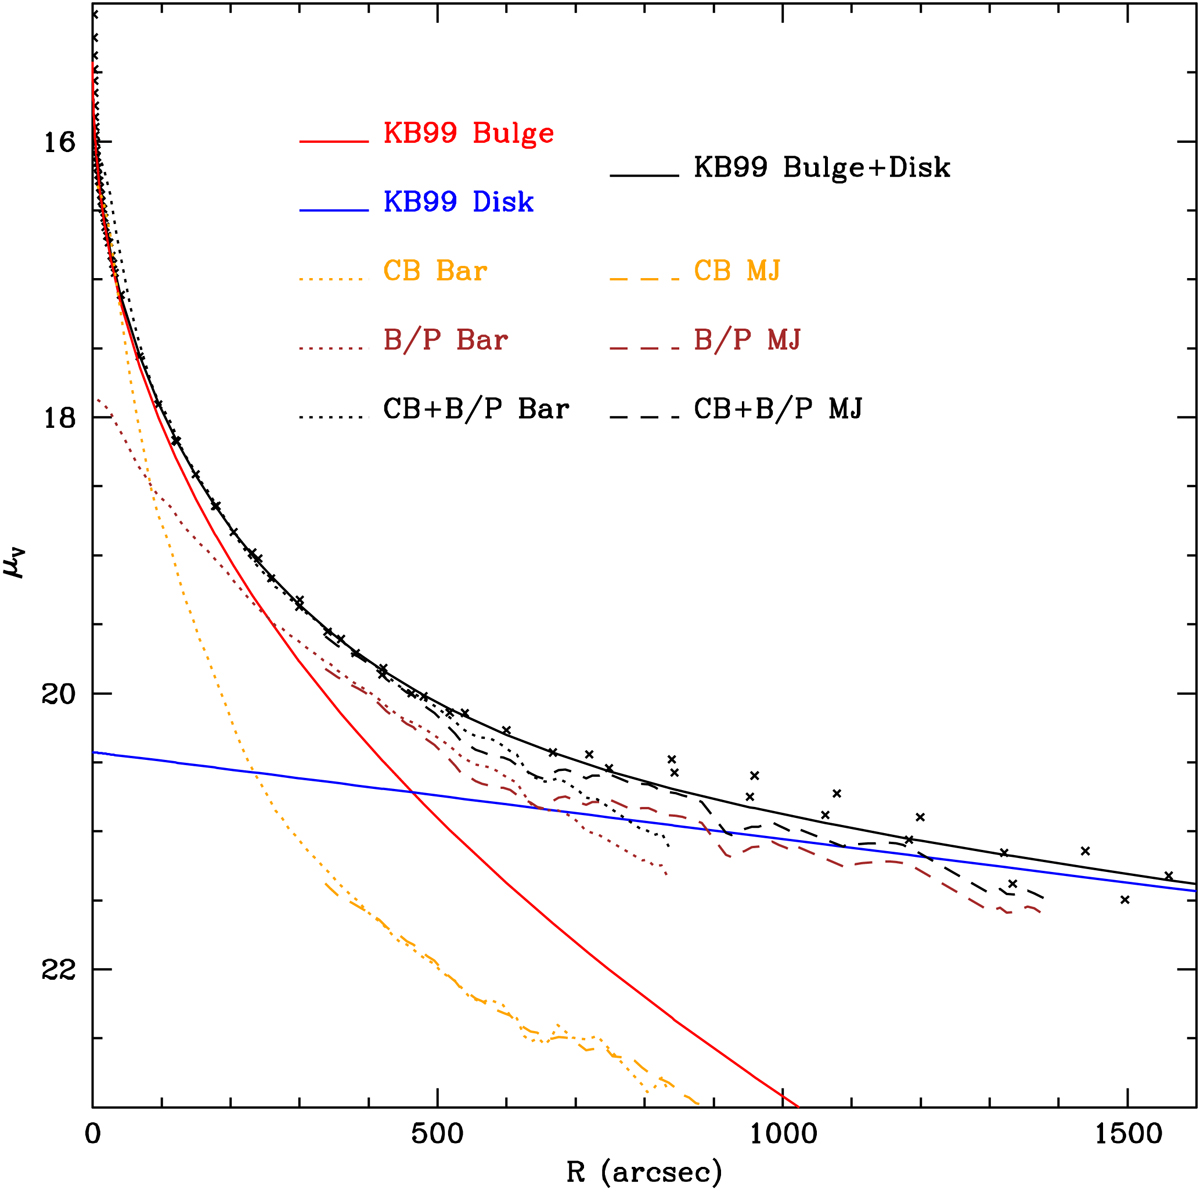
V-band major axis profile (crosses), bulge (red line), and disk (blue) decomposition of Kormendy & Bender (1999). The black line shows the sum of the two components. The orange and brown dotted lines show the CB and B/P profiles, respectively, in the bar region (see Fig. 3 of Blaña Díaz et al. 2018). The black dotted line shows the sum of the two components. The orange and brown dashed lines show the CB and B/P bulge and disk profiles along the position angle of the major axis; the black dashed line indicates their sum.
Current usage metrics show cumulative count of Article Views (full-text article views including HTML views, PDF and ePub downloads, according to the available data) and Abstracts Views on Vision4Press platform.
Data correspond to usage on the plateform after 2015. The current usage metrics is available 48-96 hours after online publication and is updated daily on week days.
Initial download of the metrics may take a while.