Fig. 7
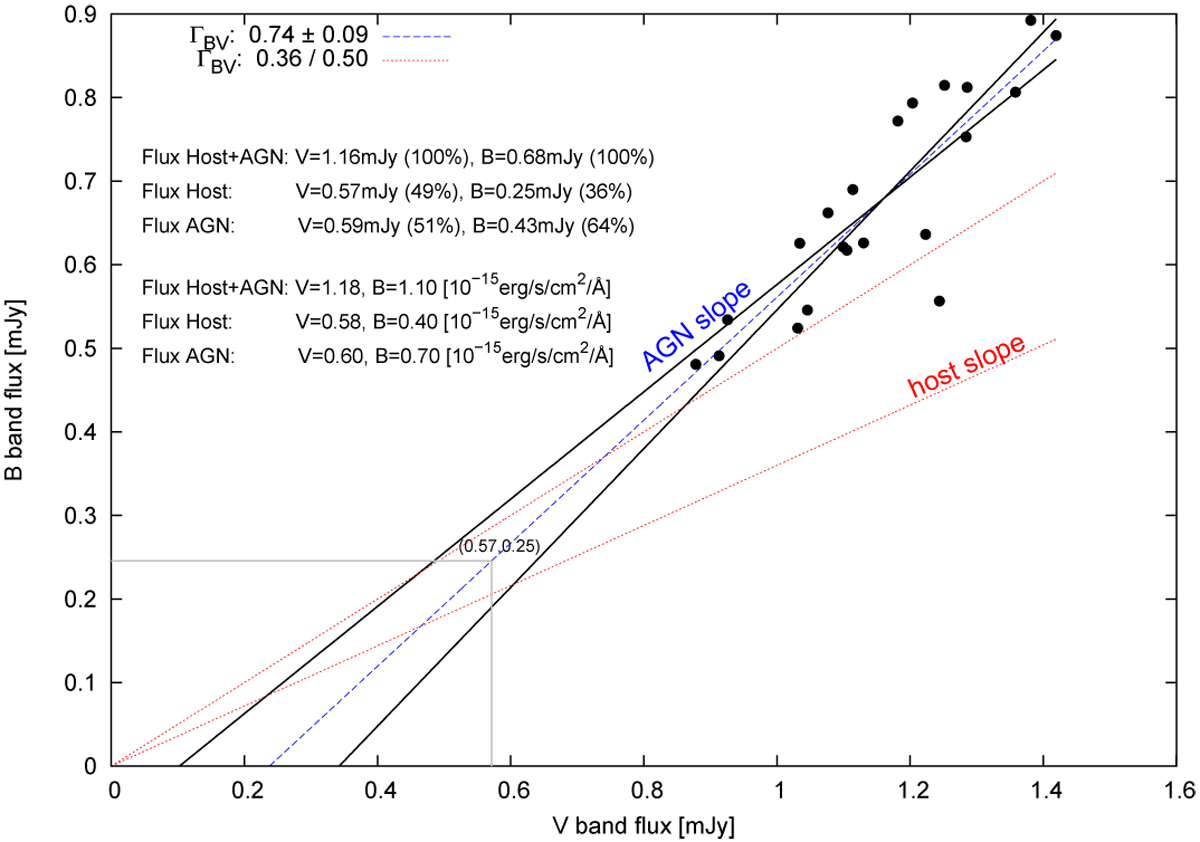
Flux variations (B vs. V) of HE 1136-2304 based on the SALT spectra. The blue dashed line is the best linear fit to the B vs. V fluxes. The black solid lines cover the upper and lower standard deviations of the interpolated AGN slope. The red dashed lines give the range of host slopes as determined by Sakata et al. (2010). The gray lines indicate the central B and V values of the host galaxy. Listed are the B and V flux values (in units of mJy and 10−15 erg s−1 cm−2 Å−1) for the combined mean host galaxy+AGN flux, for the host galaxy flux, and for the mean AGN flux.
Current usage metrics show cumulative count of Article Views (full-text article views including HTML views, PDF and ePub downloads, according to the available data) and Abstracts Views on Vision4Press platform.
Data correspond to usage on the plateform after 2015. The current usage metrics is available 48-96 hours after online publication and is updated daily on week days.
Initial download of the metrics may take a while.