Free Access
Fig. 19
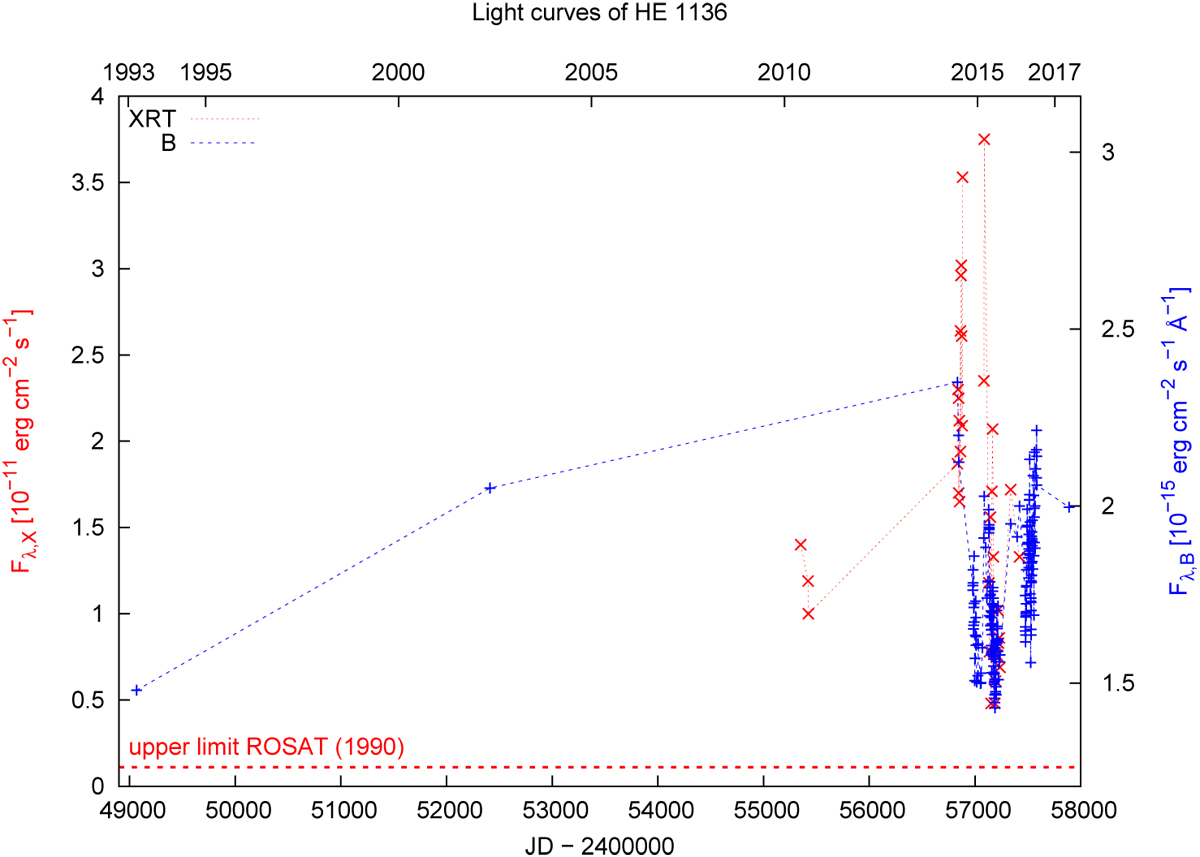
Long-term optical (blue) and X-ray (red) light curves of HE 1136-2304 from 1993 to 2017. The Swift X-ray data and the upper X-ray limit in 1990 based on ROSAT is presented in red (left axis label). The B-band data are scaled with respect to the X-ray data, and are shown in blue (right axis label).
Current usage metrics show cumulative count of Article Views (full-text article views including HTML views, PDF and ePub downloads, according to the available data) and Abstracts Views on Vision4Press platform.
Data correspond to usage on the plateform after 2015. The current usage metrics is available 48-96 hours after online publication and is updated daily on week days.
Initial download of the metrics may take a while.