Fig. 13
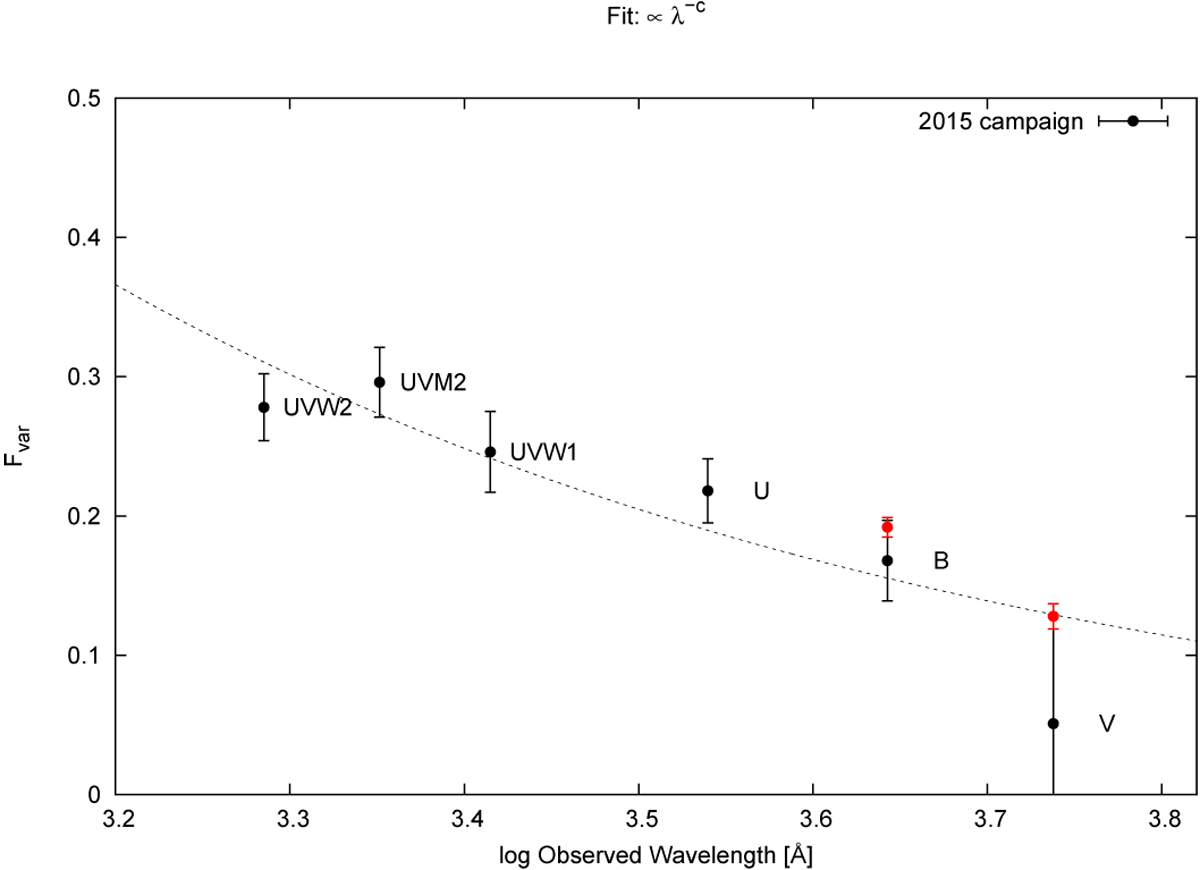
Fractional variations of the UV and optical continuum bands derived from the Swift data in 2015 as a function of wavelength. Furthermore, the B and V band measurements based on the photometric data taken in 2015 have been added. The contribution of the host galaxy has been subtracted in all cases. The dashed line shows a general fit with an exponent c = 0.84.
Current usage metrics show cumulative count of Article Views (full-text article views including HTML views, PDF and ePub downloads, according to the available data) and Abstracts Views on Vision4Press platform.
Data correspond to usage on the plateform after 2015. The current usage metrics is available 48-96 hours after online publication and is updated daily on week days.
Initial download of the metrics may take a while.