Free Access
Fig. 12
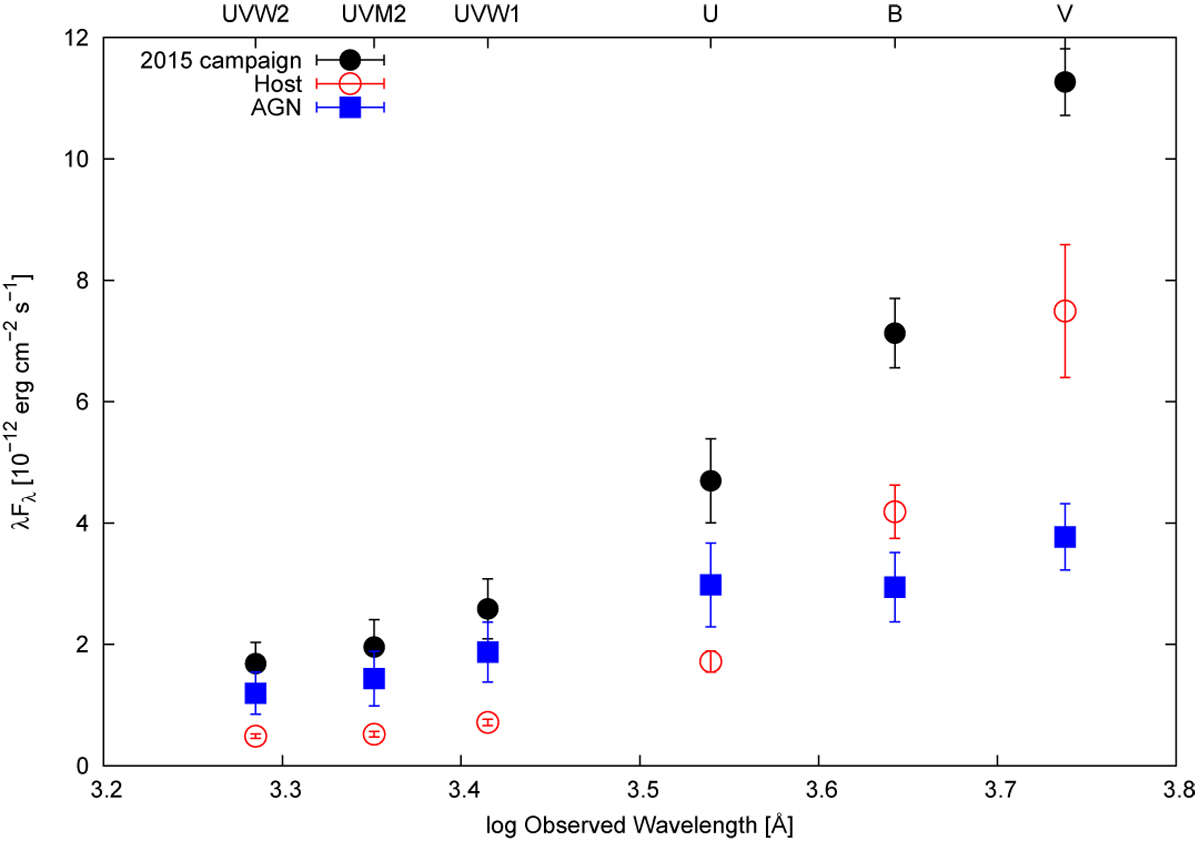
Mean UV and optical spectral energy distribution of HE 1136-2304 based on the Swift data taken in 2015 (black filled circles). The red open circles and the blue squares indicate the contributions of the host galaxy and the AGN, respectively.
Current usage metrics show cumulative count of Article Views (full-text article views including HTML views, PDF and ePub downloads, according to the available data) and Abstracts Views on Vision4Press platform.
Data correspond to usage on the plateform after 2015. The current usage metrics is available 48-96 hours after online publication and is updated daily on week days.
Initial download of the metrics may take a while.