Free Access
Fig. 11
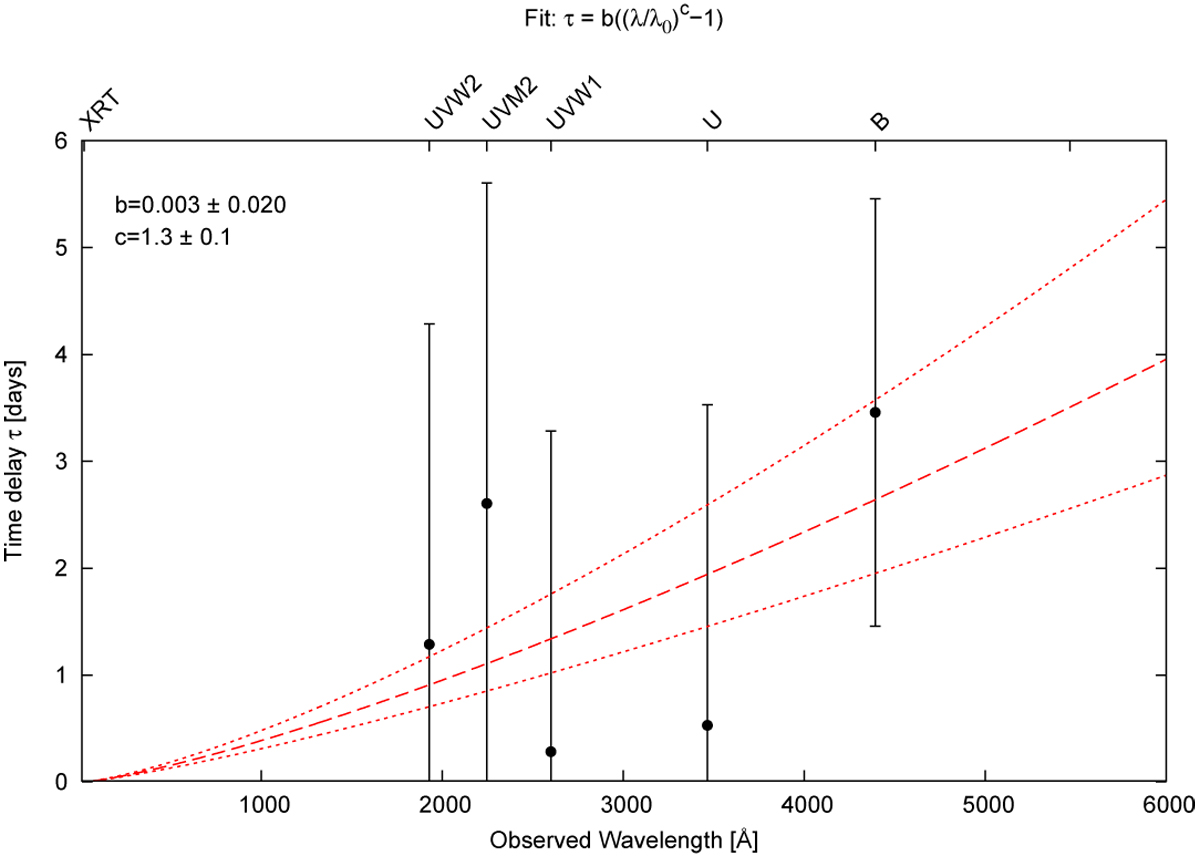
Time delay of the Swift UV and optical bands with respect to the Swift XRT light curve as a function of the wavelength of the Swift bands. The V band has been excluded as it showed a very low correlation coefficient. The dashed line shows the best fit to the data. The dotted lines give the error of the exponent c.
Current usage metrics show cumulative count of Article Views (full-text article views including HTML views, PDF and ePub downloads, according to the available data) and Abstracts Views on Vision4Press platform.
Data correspond to usage on the plateform after 2015. The current usage metrics is available 48-96 hours after online publication and is updated daily on week days.
Initial download of the metrics may take a while.