Fig. 2

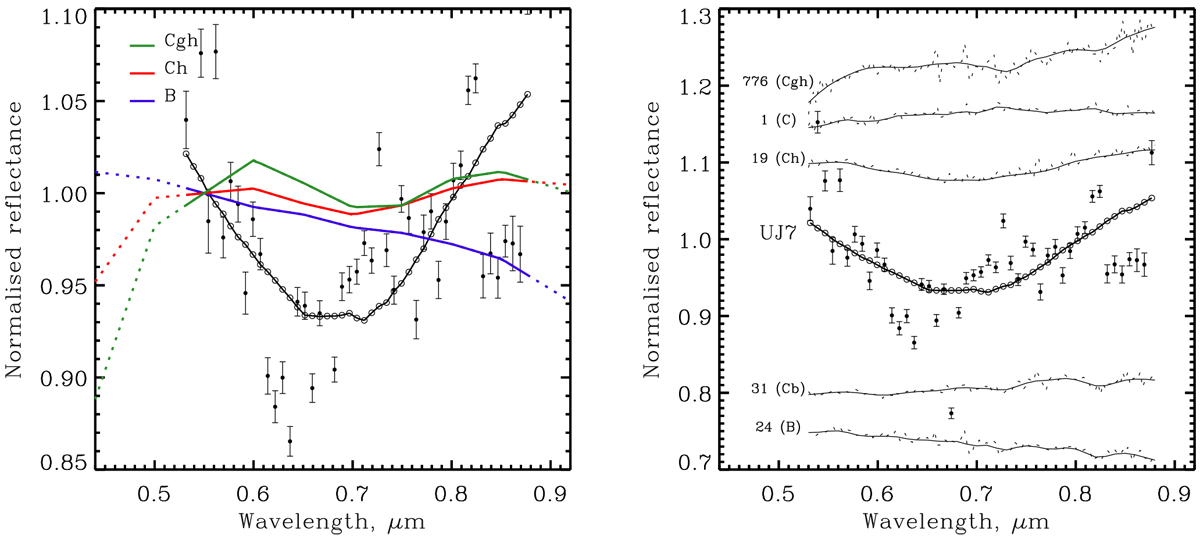
Left panel: average spectra of Ch, Cgh, and B classes from Bus & Binzel (2002) (red, green, and blue lines, respectively) together with the binned spectrum of UJ7 (black dots). The solid colour lines show the observed wavelength coverage of the average database spectra and the solid line with open circles represents least-squares (Savitzky–Golay) polynomial smoothing filter with window width equal to 47 of the observations. Right panel: comparison of the UJ7 spectrum (the same binned and smoothed as on the left panel) with spectra of other asteroids (thin lines and dots) belonging to the taxonomic classes in Table 3. The spectra of the various asteroids represented in this figure are all normalised to 0.55 μm, but each spectrum (apart from that of UJ7) has been shifted up or down by some amount for the sake of clarity.
Current usage metrics show cumulative count of Article Views (full-text article views including HTML views, PDF and ePub downloads, according to the available data) and Abstracts Views on Vision4Press platform.
Data correspond to usage on the plateform after 2015. The current usage metrics is available 48-96 hours after online publication and is updated daily on week days.
Initial download of the metrics may take a while.


