Fig. 2
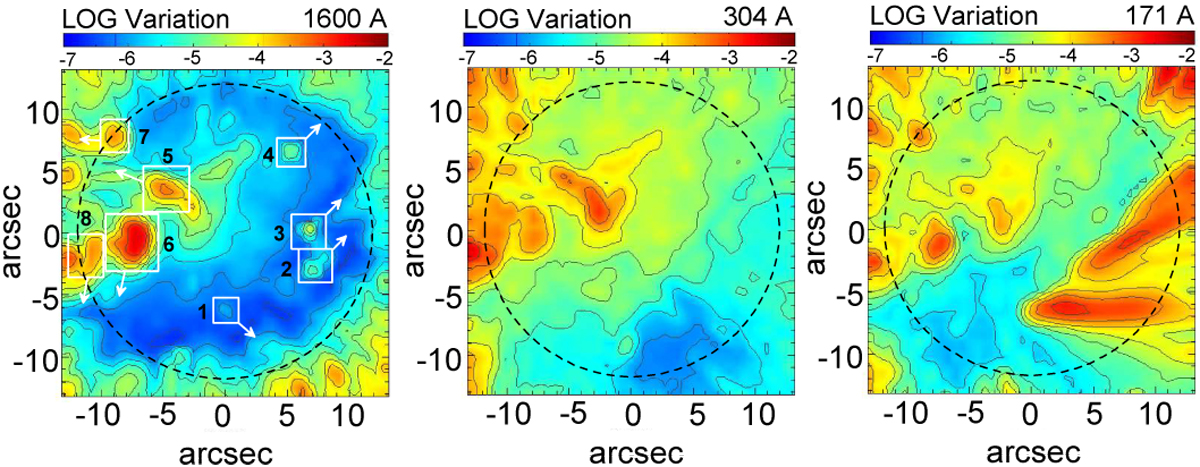
Variation maps of umbral UV emission in the SDO/AIA different temperature channels (1600 Å, 304 Å, and 171 Å) obtained during 00:00-03:20 UT observation NOAA 11131 on December 08, 2010. Squares with numerals indicate the position of observed UF sources. The arrows show the scanning direction when obtaining the time-distance plots. The dash circle outlines schematically the umbral boundary. The variation intensity is presented by colours in the logarithmic scale.
Current usage metrics show cumulative count of Article Views (full-text article views including HTML views, PDF and ePub downloads, according to the available data) and Abstracts Views on Vision4Press platform.
Data correspond to usage on the plateform after 2015. The current usage metrics is available 48-96 hours after online publication and is updated daily on week days.
Initial download of the metrics may take a while.