Fig. 3
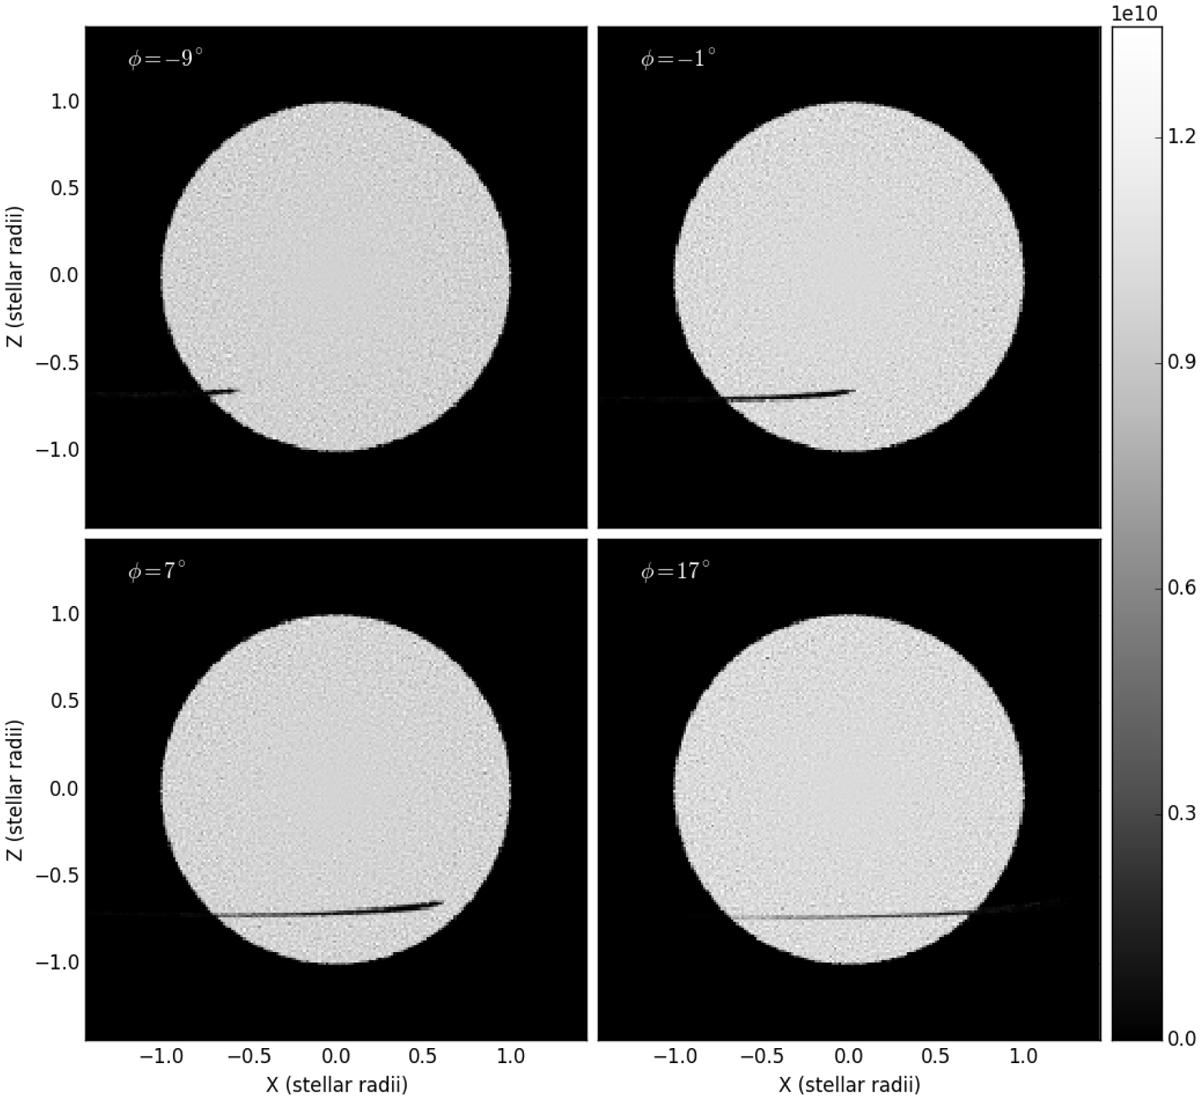
Images generated by MCMax3D for the tail configuration presented in Sect. 3.1 at λ = 650 nm for different azimuthal viewing angles corresponding to orbital phases ϕ = −9°, − 1°, 7° and 17°, with an elevation viewing angle of 81.52° as measured from the pole of the orbital plane. Integrating the flux of images such as these for different azimuthal viewing angles produces a transit light curve.
Current usage metrics show cumulative count of Article Views (full-text article views including HTML views, PDF and ePub downloads, according to the available data) and Abstracts Views on Vision4Press platform.
Data correspond to usage on the plateform after 2015. The current usage metrics is available 48-96 hours after online publication and is updated daily on week days.
Initial download of the metrics may take a while.