Fig. 21
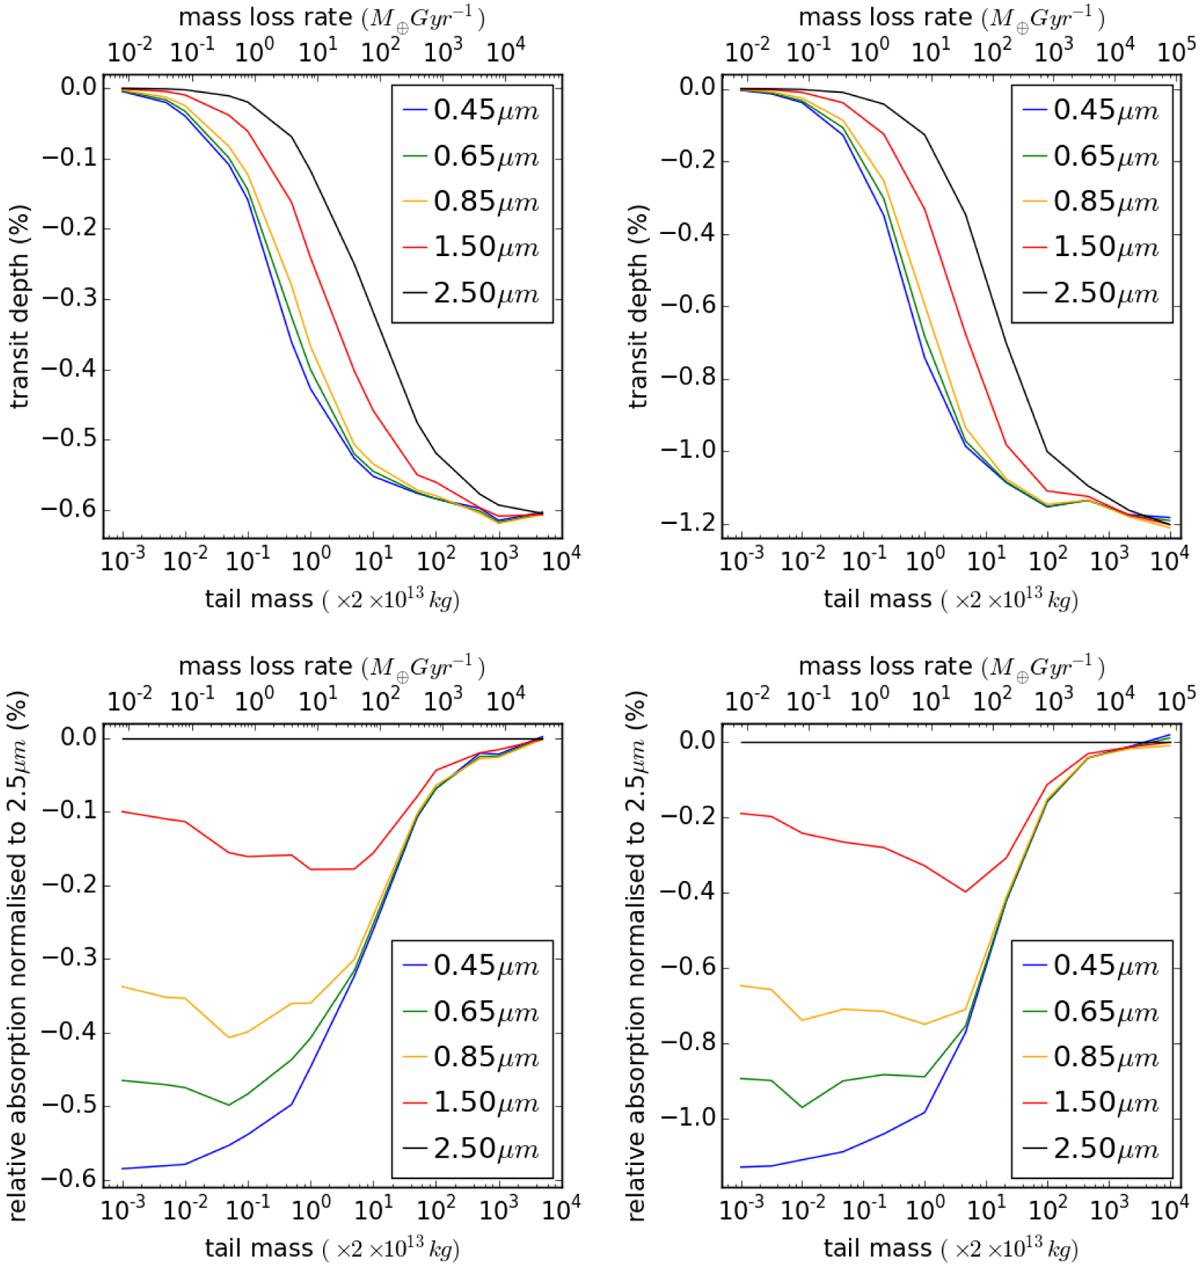
Transit depth in different wavelengths as a function of dust mass in the tail on the bottom horizontal axis or dust mass-loss rate, assuming an initial meta-particle size of 1 μm and a meta-particle density of 4.02 g cm−3, corresponding to the density of corundum, on the top horizontal axis. The left panels are for a meta-particle ejection velocity of 272 m s−1 and the rightpanels are for meta-particle ejection velocities of 679 m s−1. The first row shows the absolute transit depth as a function of tail mass. The lower row presents the same data as the upper panels, however all wavelength light curves were normalised to the light curve of 2.5 μm and were scaled so that every tail dust mass had the same transit depth to highlight the wavelength dependence.
Current usage metrics show cumulative count of Article Views (full-text article views including HTML views, PDF and ePub downloads, according to the available data) and Abstracts Views on Vision4Press platform.
Data correspond to usage on the plateform after 2015. The current usage metrics is available 48-96 hours after online publication and is updated daily on week days.
Initial download of the metrics may take a while.