Free Access
Fig. 2
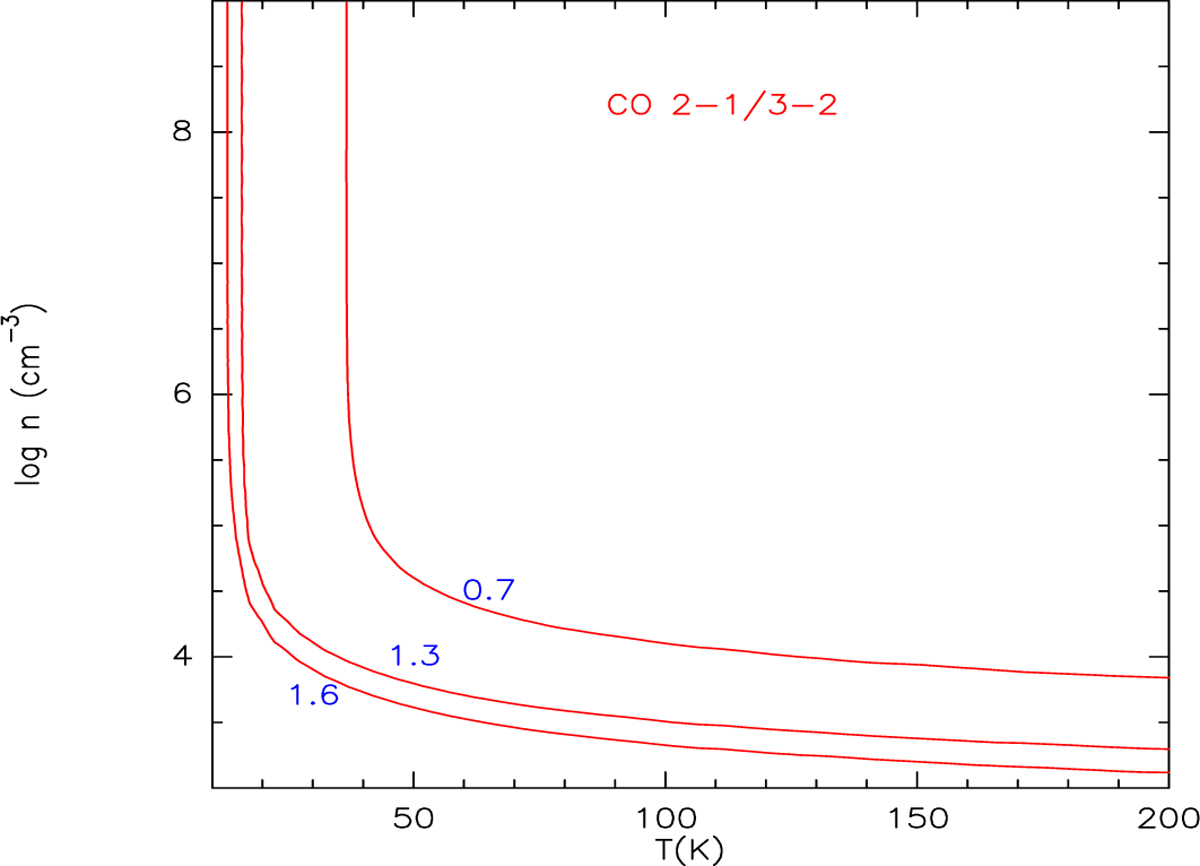
Results from the LVG analysis of the CO lines. The curves represent the predicted CO (J = 3−2) to CO (J = 2–1) intensity ratio for a column density of 1 × 1016 cm−2 and line width of 50 km s−1. The ratios that match the observed CO line ratio and are indicated with solid red curves.
Current usage metrics show cumulative count of Article Views (full-text article views including HTML views, PDF and ePub downloads, according to the available data) and Abstracts Views on Vision4Press platform.
Data correspond to usage on the plateform after 2015. The current usage metrics is available 48-96 hours after online publication and is updated daily on week days.
Initial download of the metrics may take a while.