Fig. 3.
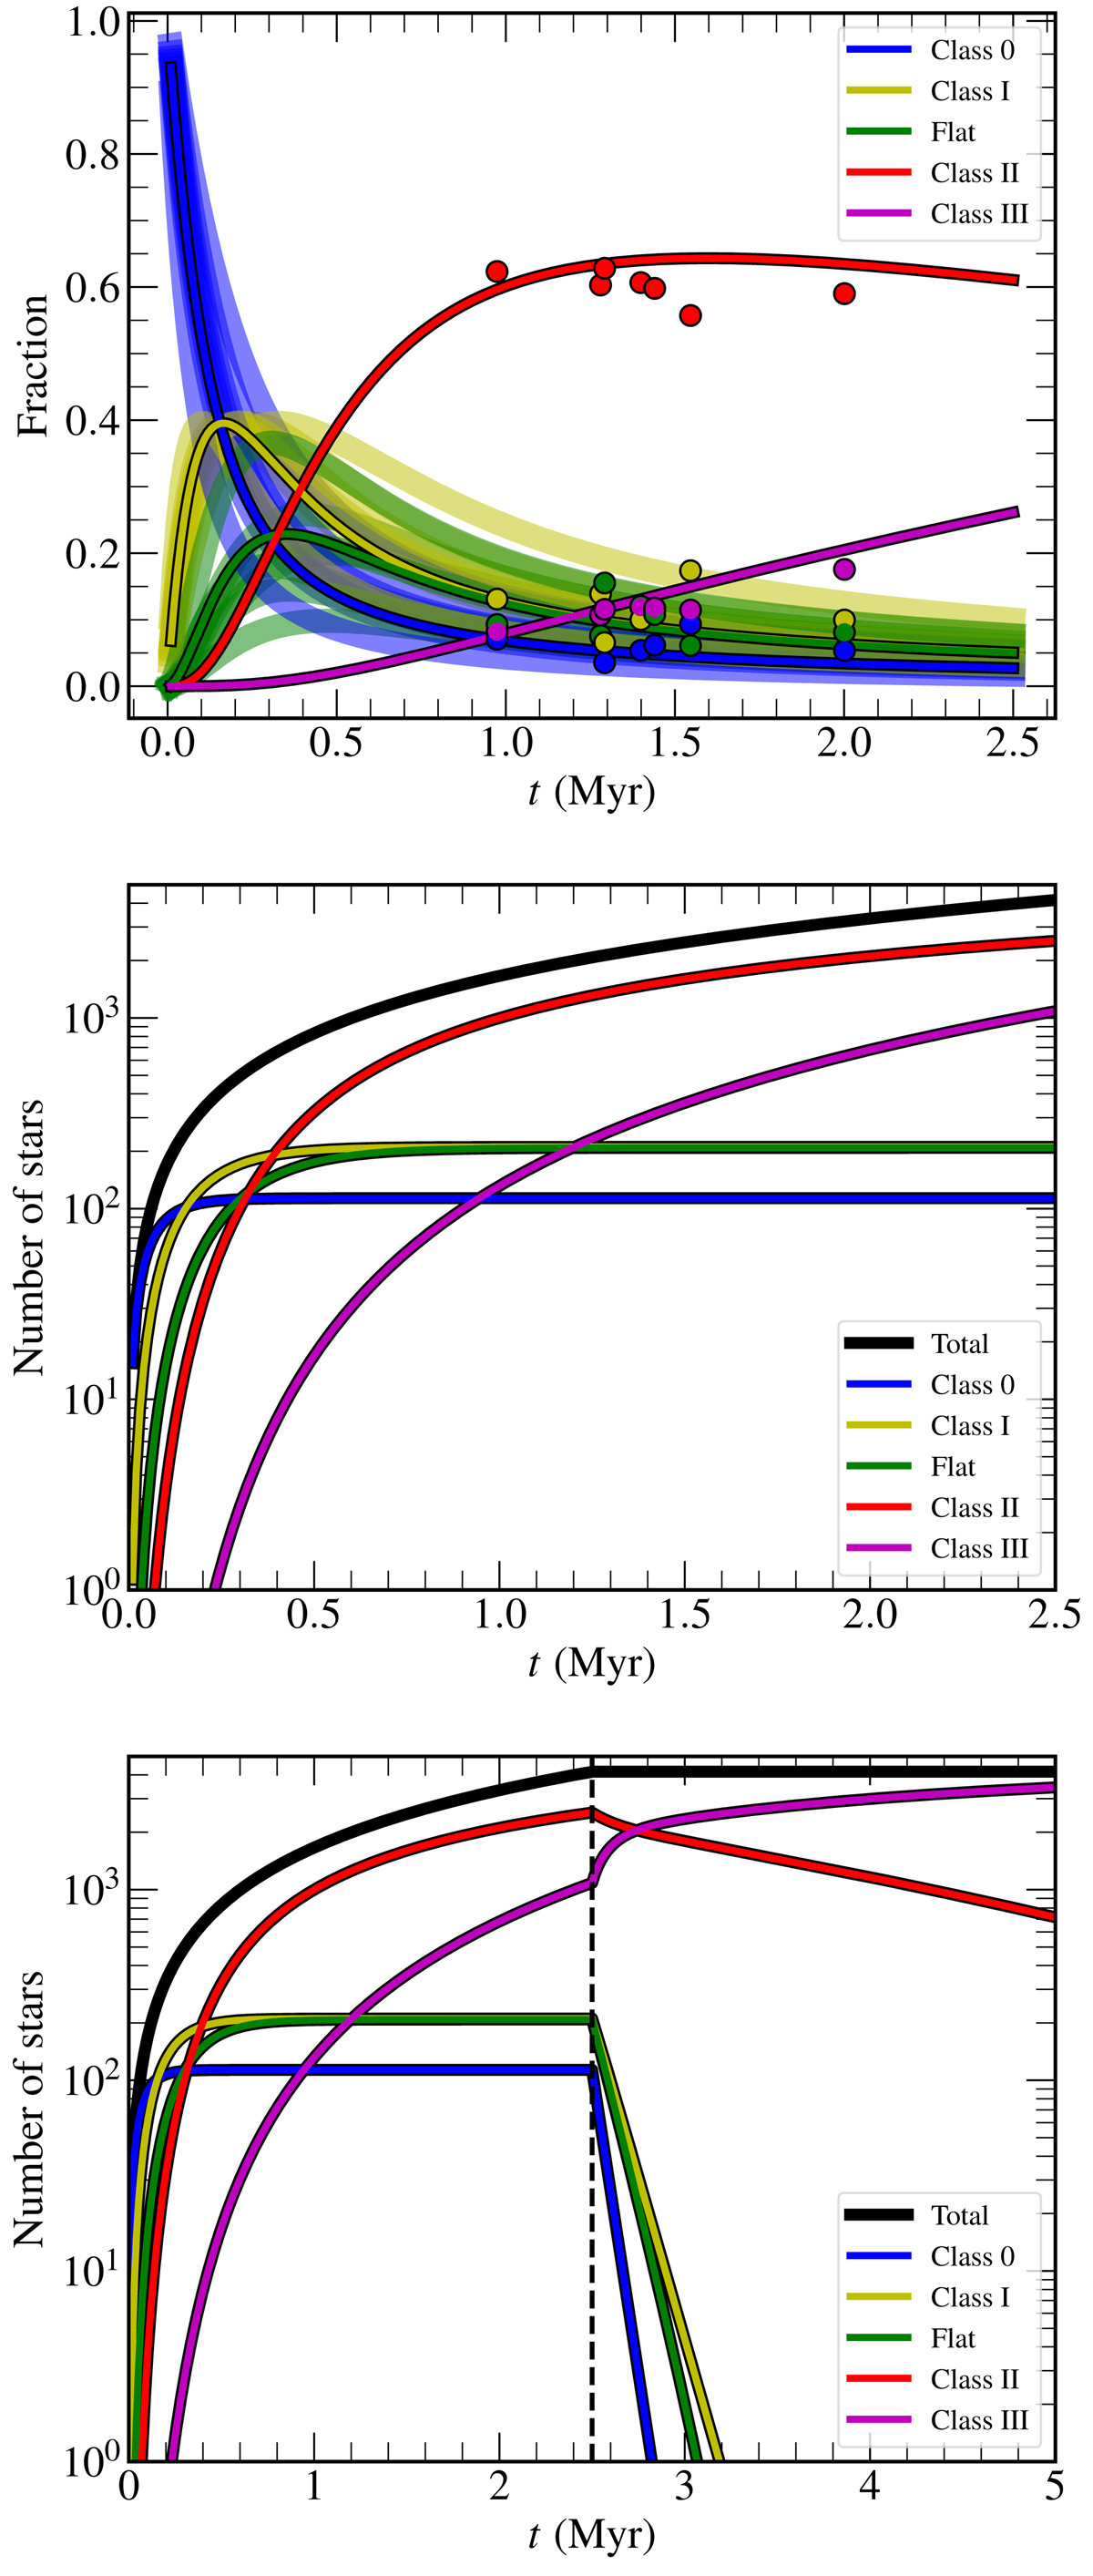
Top: mean fraction of protostars in a given class as a function of time. The thick semi-transparent lines in the background show the results for each cloud, whereas the black/colored lines show the results for the total population. Observed fractions are shown as dots. The fraction of Class III sources is obtained as NIII = Ntot − NII − Nflat − NI − N0. Middle: absolute number of stars in each class as a function of time for all clouds together, for the star formation rate provided in Table 3. Bottom: same as middle panel, but with a cut-off time of 2.5 Myr after which the star-formation rate is set to zero, as indicated by the vertical dashed line. When the rate is zero, the total number of stars naturally remains constant.
Current usage metrics show cumulative count of Article Views (full-text article views including HTML views, PDF and ePub downloads, according to the available data) and Abstracts Views on Vision4Press platform.
Data correspond to usage on the plateform after 2015. The current usage metrics is available 48-96 hours after online publication and is updated daily on week days.
Initial download of the metrics may take a while.