Fig. 9
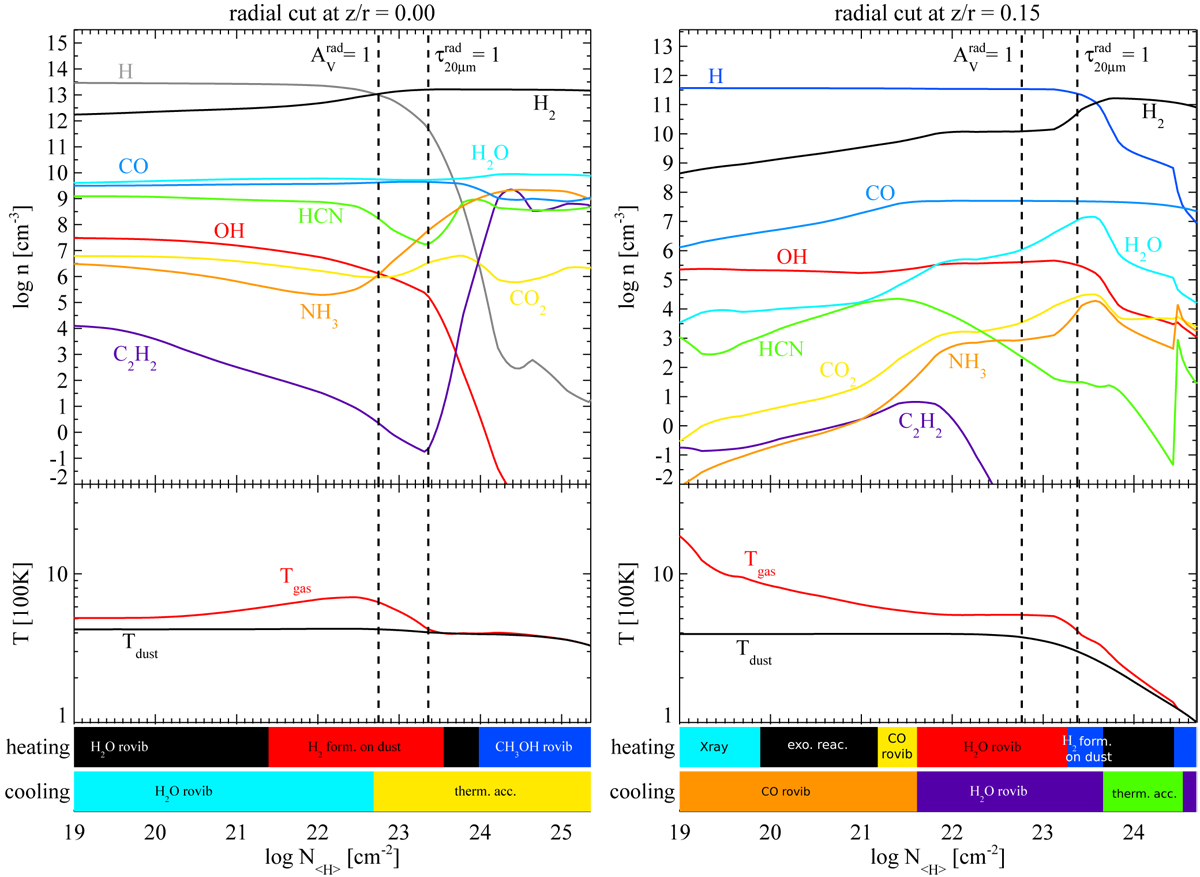
Abundances of mid-IR active molecules along radial cuts at constant z∕r through the disc model with inner disc radius Rin = 1 au and g/d = 100, plotted as a function of the radial hydrogen nuclei column density N⟨H⟩ (see text for how N⟨H⟩ corresponds to r). The two vertical dashed lines indicate where the radial dust optical depth is one (![]() ), and where the radial dust optical depth at λ = 20 μm is one. The lower plot shows the gas and dust temperature along that cut. The coloured bars below indicate the most important heating and cooling processes.
), and where the radial dust optical depth at λ = 20 μm is one. The lower plot shows the gas and dust temperature along that cut. The coloured bars below indicate the most important heating and cooling processes.
Current usage metrics show cumulative count of Article Views (full-text article views including HTML views, PDF and ePub downloads, according to the available data) and Abstracts Views on Vision4Press platform.
Data correspond to usage on the plateform after 2015. The current usage metrics is available 48-96 hours after online publication and is updated daily on week days.
Initial download of the metrics may take a while.