Fig. 7
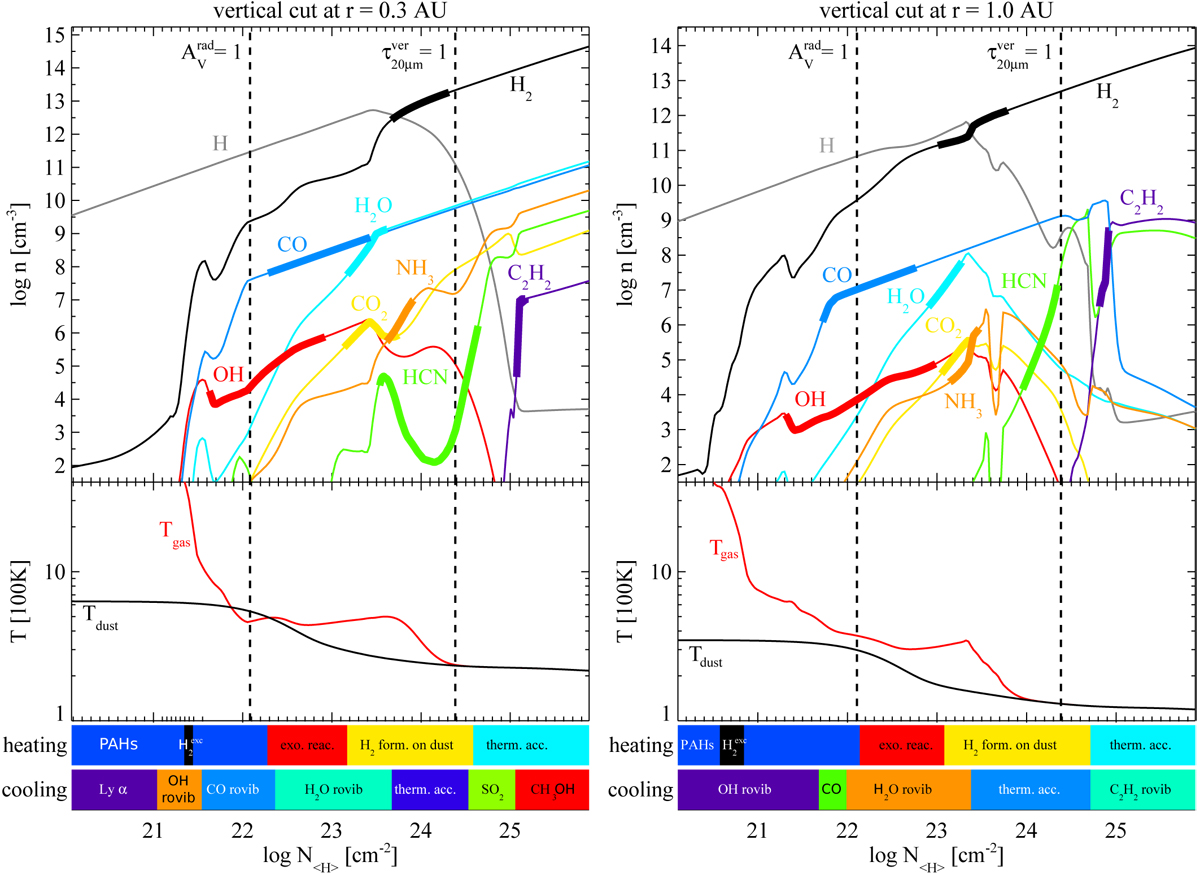
Abundances of mid-IR active molecules along vertical cuts through the disc at 0.3 au (left panel) and 1 au (right panel), plotted as a function of the vertical hydrogen nuclei column density N⟨H ⟩. The thick parts of the graphs highlight the mid-IR line forming regions of the respective molecules (see Eq. (4) and text). The two vertical dashed lines indicate where the radial dust optical depths is one (![]() ), and where the vertical dust optical depth at λ = 20 μm is one. The lower plot shows the vertical gas and dust temperature structure in the disc. The coloured bars below indicate the most important heating and cooling processes: rovib = ro-vibrational, therm. acc. = thermal accommodation, exo. reac. = exothermal chemical reactions, form. = formation.
), and where the vertical dust optical depth at λ = 20 μm is one. The lower plot shows the vertical gas and dust temperature structure in the disc. The coloured bars below indicate the most important heating and cooling processes: rovib = ro-vibrational, therm. acc. = thermal accommodation, exo. reac. = exothermal chemical reactions, form. = formation.
Current usage metrics show cumulative count of Article Views (full-text article views including HTML views, PDF and ePub downloads, according to the available data) and Abstracts Views on Vision4Press platform.
Data correspond to usage on the plateform after 2015. The current usage metrics is available 48-96 hours after online publication and is updated daily on week days.
Initial download of the metrics may take a while.