Fig. 6
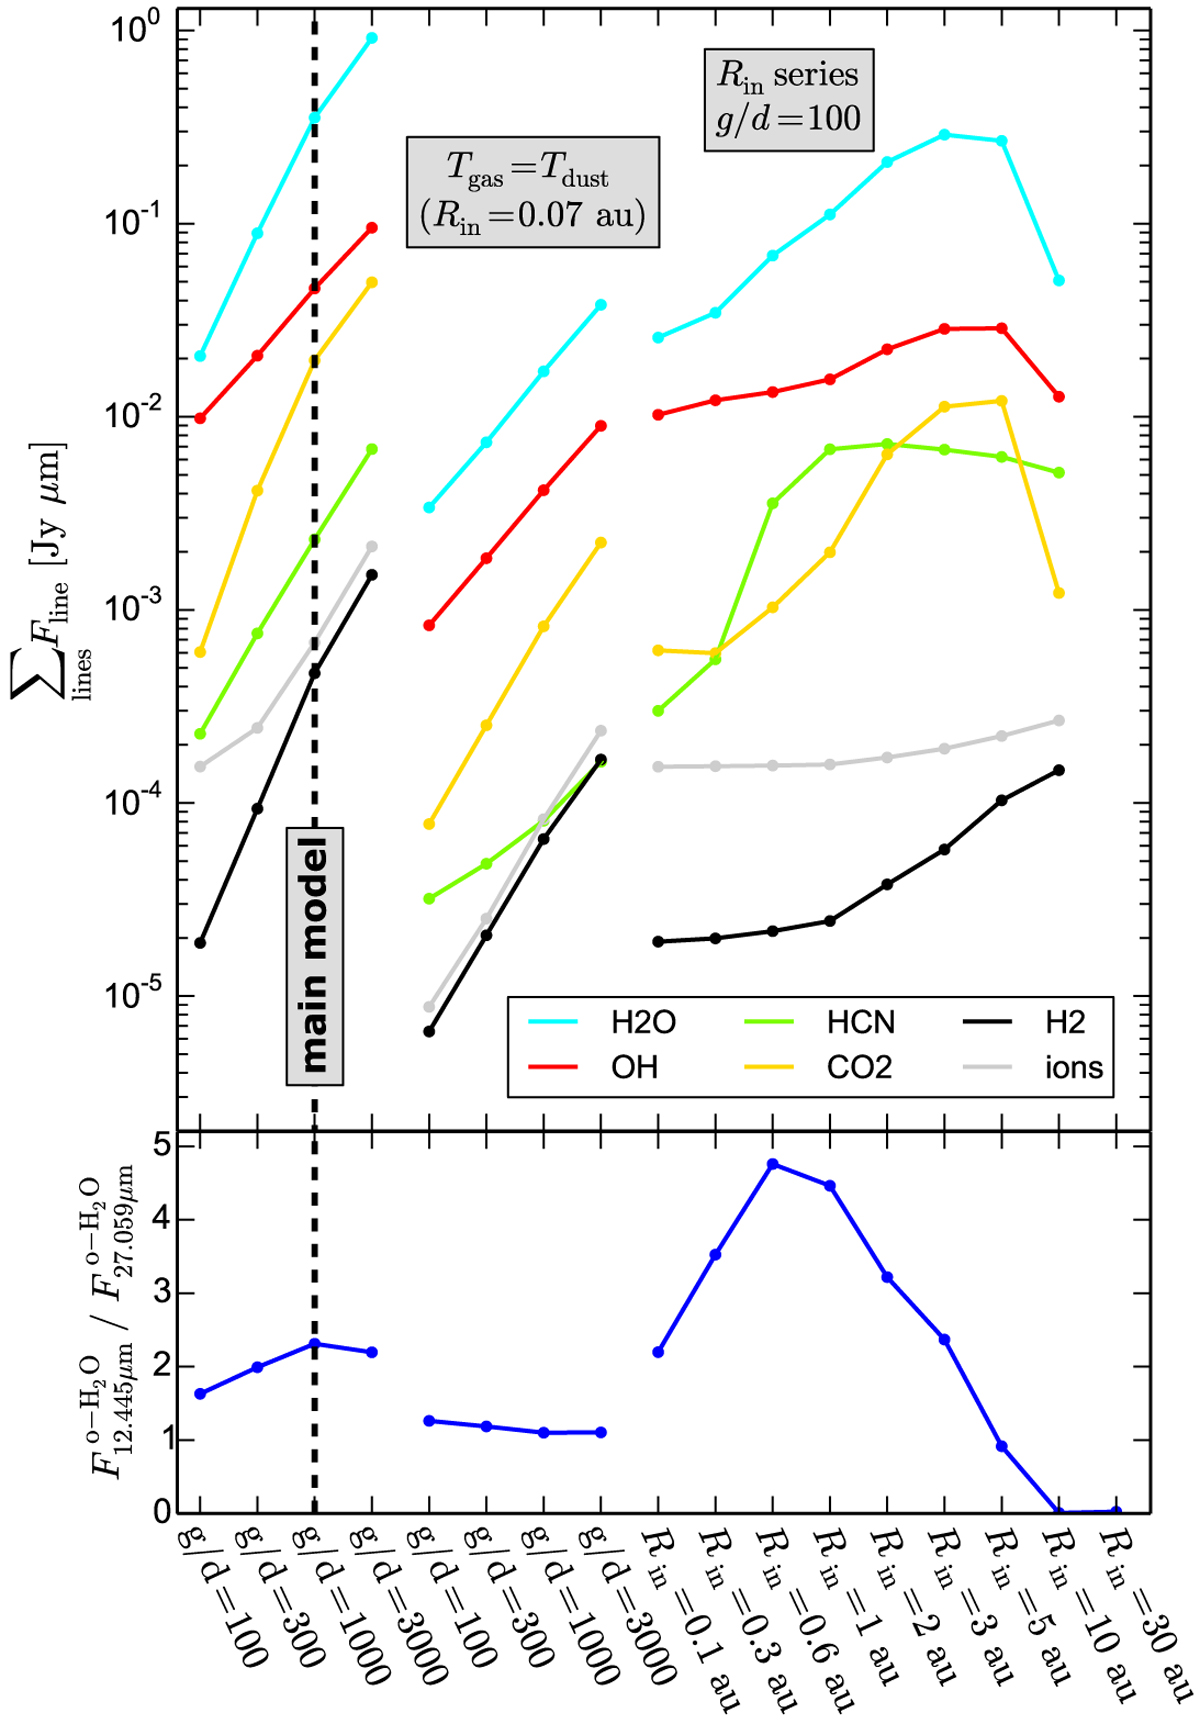
Upper part: sum of all line fluxes emitted by the different molecules between 9.7 and 38 μm. The vertical dashed line indicates the main model as plotted in Figs. 4 and 5, which is broadly consistent with the observations. Lower part: colour of the water line emission spectrum in the form of a ratio of two o-H2 O lines at about 12 and 27 μm. In the series of 4 models on the left, the gas/dust mass ratio in the disc is varied, the calculated gas temperatures are used, and Rin = 0.07 au is assumed. In the series of 4 models in the centre, the gas/dust mass ratio in the disc is varied while Tgas =Tdust and Rin = 0.07 au are assumed. In the series of models on the right, the disc inner radius Rin is varied while assuming g/d = 100 and using the calculated gas temperatures. “H2O” is the combined emission from o-H2O and p-H2O, and “OH” isthe combined emission from rotational OH lines and ro-vibrational OH_H lines; see Table 3.
Current usage metrics show cumulative count of Article Views (full-text article views including HTML views, PDF and ePub downloads, according to the available data) and Abstracts Views on Vision4Press platform.
Data correspond to usage on the plateform after 2015. The current usage metrics is available 48-96 hours after online publication and is updated daily on week days.
Initial download of the metrics may take a while.