Fig. 5
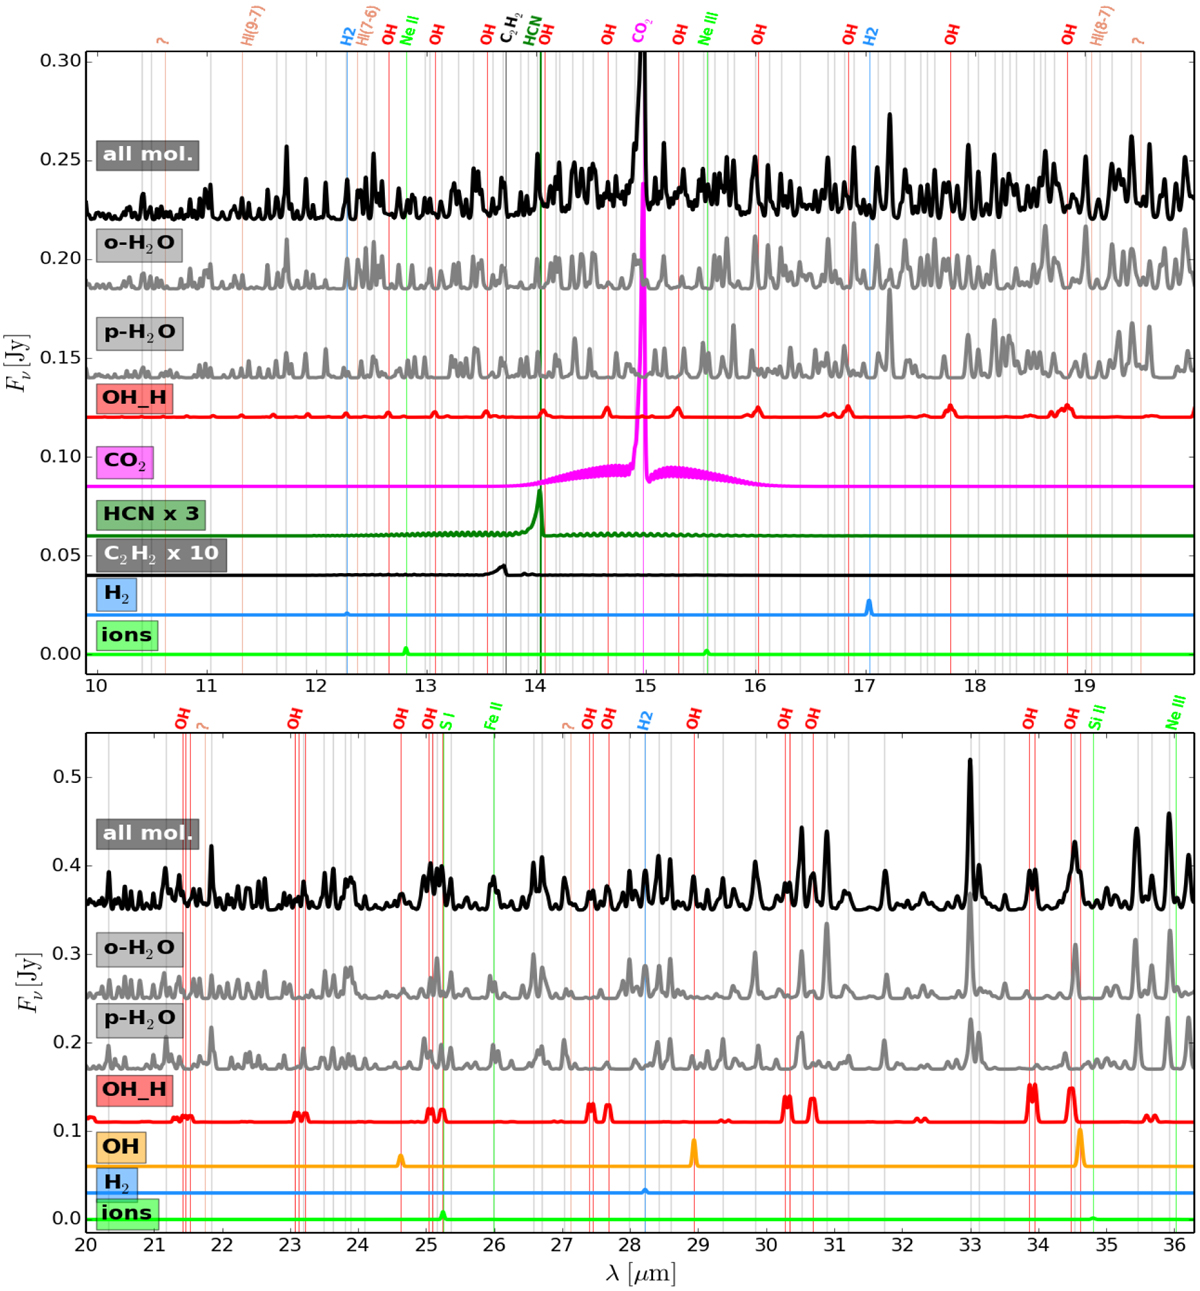
g/d = 1000 model spectrum is decomposed into its main molecular constituents. We use the notation “OH_H” for ro-vibrational OH lines from the HITRAN database in contrast to the pure rotational lines computed in non-LTE and denoted by “OH”. These single molecule spectra are convolved to R = 600 and arbitrarily shifted, but not scaled except for C2H2 and HCN. The C2H2 lines around 13.7 μm are very weak in the model, and are amplified by a factor of ten in this figure to make them visible. The vertical coloured lines and top labels identify the molecules and ions in the same way as in Fig. 4.
Current usage metrics show cumulative count of Article Views (full-text article views including HTML views, PDF and ePub downloads, according to the available data) and Abstracts Views on Vision4Press platform.
Data correspond to usage on the plateform after 2015. The current usage metrics is available 48-96 hours after online publication and is updated daily on week days.
Initial download of the metrics may take a while.