Fig. 4
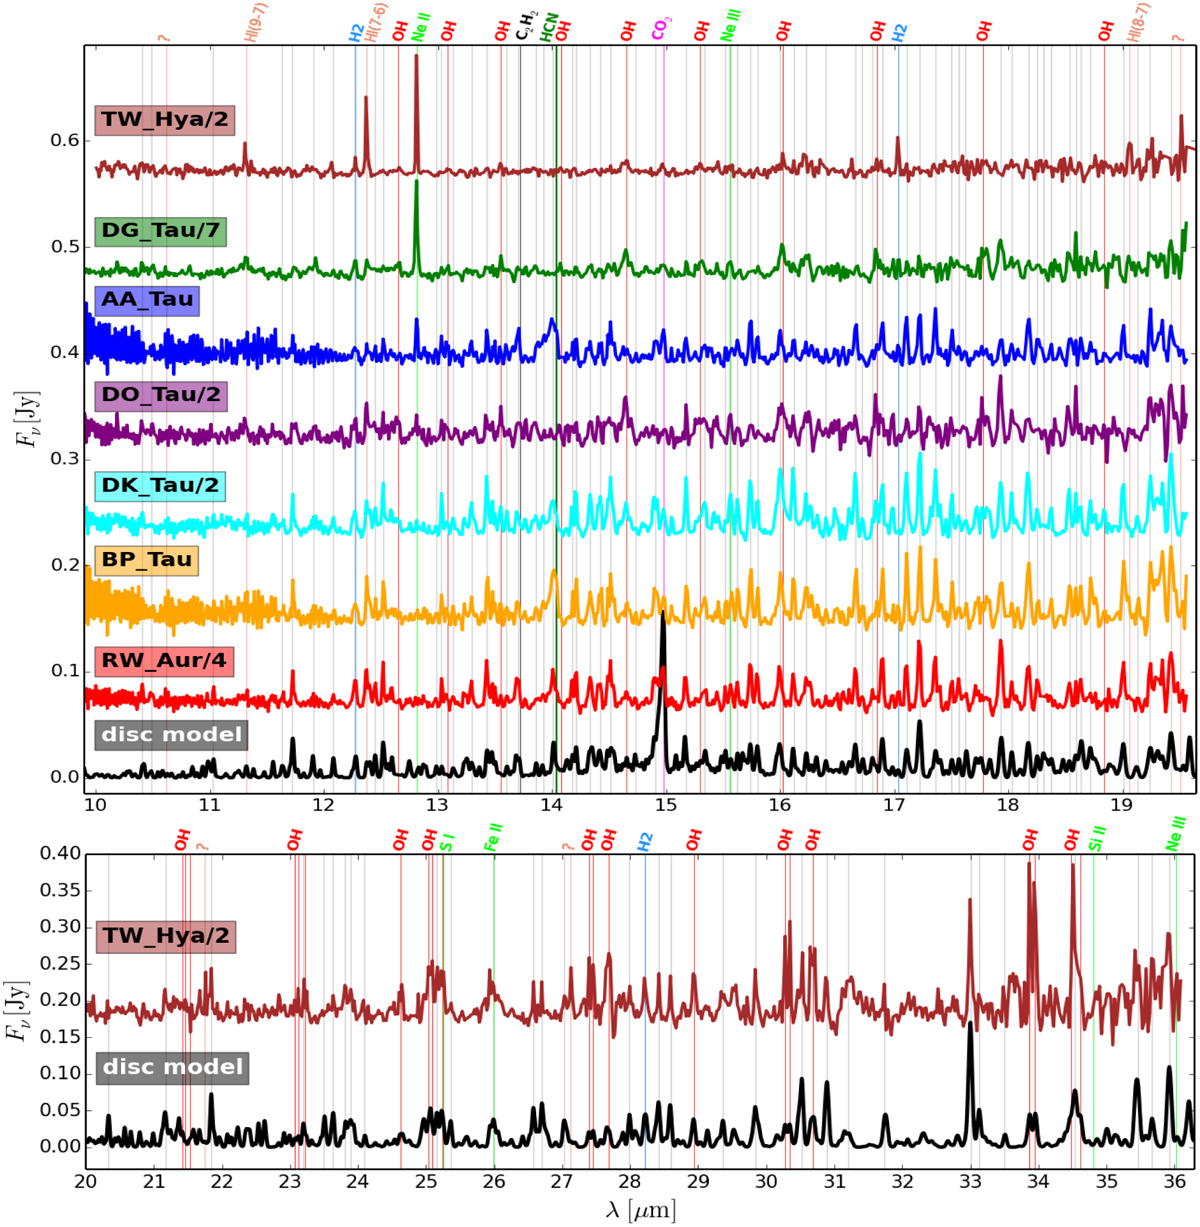
Upper panel: seven continuum-subtracted R = 600 Spitzer/IRS spectra of T Tauri stars (coloured lines) from Zhang et al. (2013; TW Hya) and Rigliaco et al. (2015; all other objects), arbitrarily shifted and scaled as indicated. At the bottom of the upper panel, the continuum-subtracted PRODIMO/FLITS spectrum of our main disc model with gas/dust = 1000 is shown in black (convolved to R = 600). Lower plot: model spectrum is continued for longer wavelengths and compared to the observations of TW Hya with strong OH lines. The thin vertical coloured lines and top labels identify the molecules and ions. All unlabelled grey vertical lines indicate water lines. The salmon-coloured lines have no counterpart in the model; they are either high-excitation neutral hydrogen lines as indicated or are unidentified when labelled with “?”.
Current usage metrics show cumulative count of Article Views (full-text article views including HTML views, PDF and ePub downloads, according to the available data) and Abstracts Views on Vision4Press platform.
Data correspond to usage on the plateform after 2015. The current usage metrics is available 48-96 hours after online publication and is updated daily on week days.
Initial download of the metrics may take a while.