Fig. 3
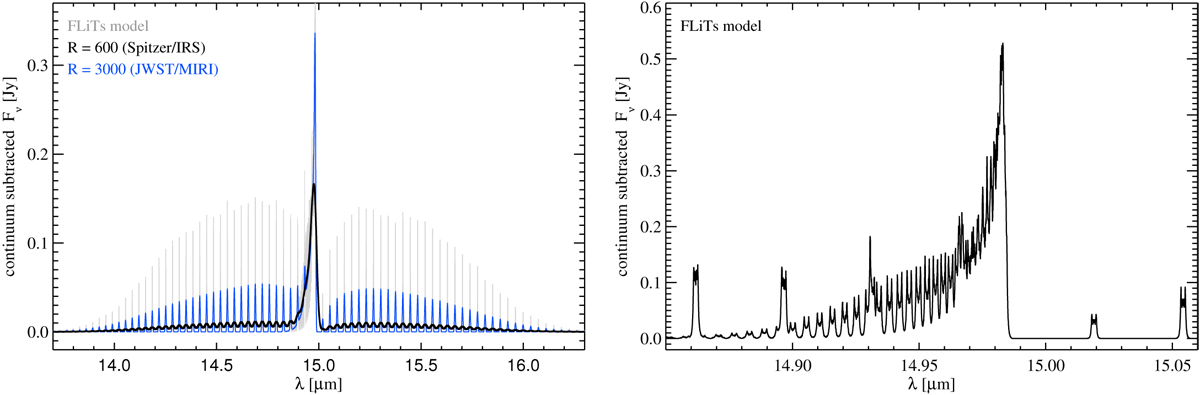
Pure CO2 011 0(1) → 0000(1) emission spectrum around 15 μm, showing the central Q-branch and the P and R side branches. Left panel: full wavelength range is depicted; the grey line shows the original FLITS spectrum, the black line shows the results convolved with a R = 600 Gaussian, and the blue line the results convolved with a R = 3000 Gaussian. Right panel: zoom into the Q-branch band-head, plotting only the original FLITS spectrum. The individual lines have Keplerian double-peaked profiles, and merge with each other at maximum. At the band head, the total flux is smaller than expected from the sum of the individual Q-branch line fluxes because the lines physically overlap and partly shield each other in the disc.
Current usage metrics show cumulative count of Article Views (full-text article views including HTML views, PDF and ePub downloads, according to the available data) and Abstracts Views on Vision4Press platform.
Data correspond to usage on the plateform after 2015. The current usage metrics is available 48-96 hours after online publication and is updated daily on week days.
Initial download of the metrics may take a while.