Fig. 1.
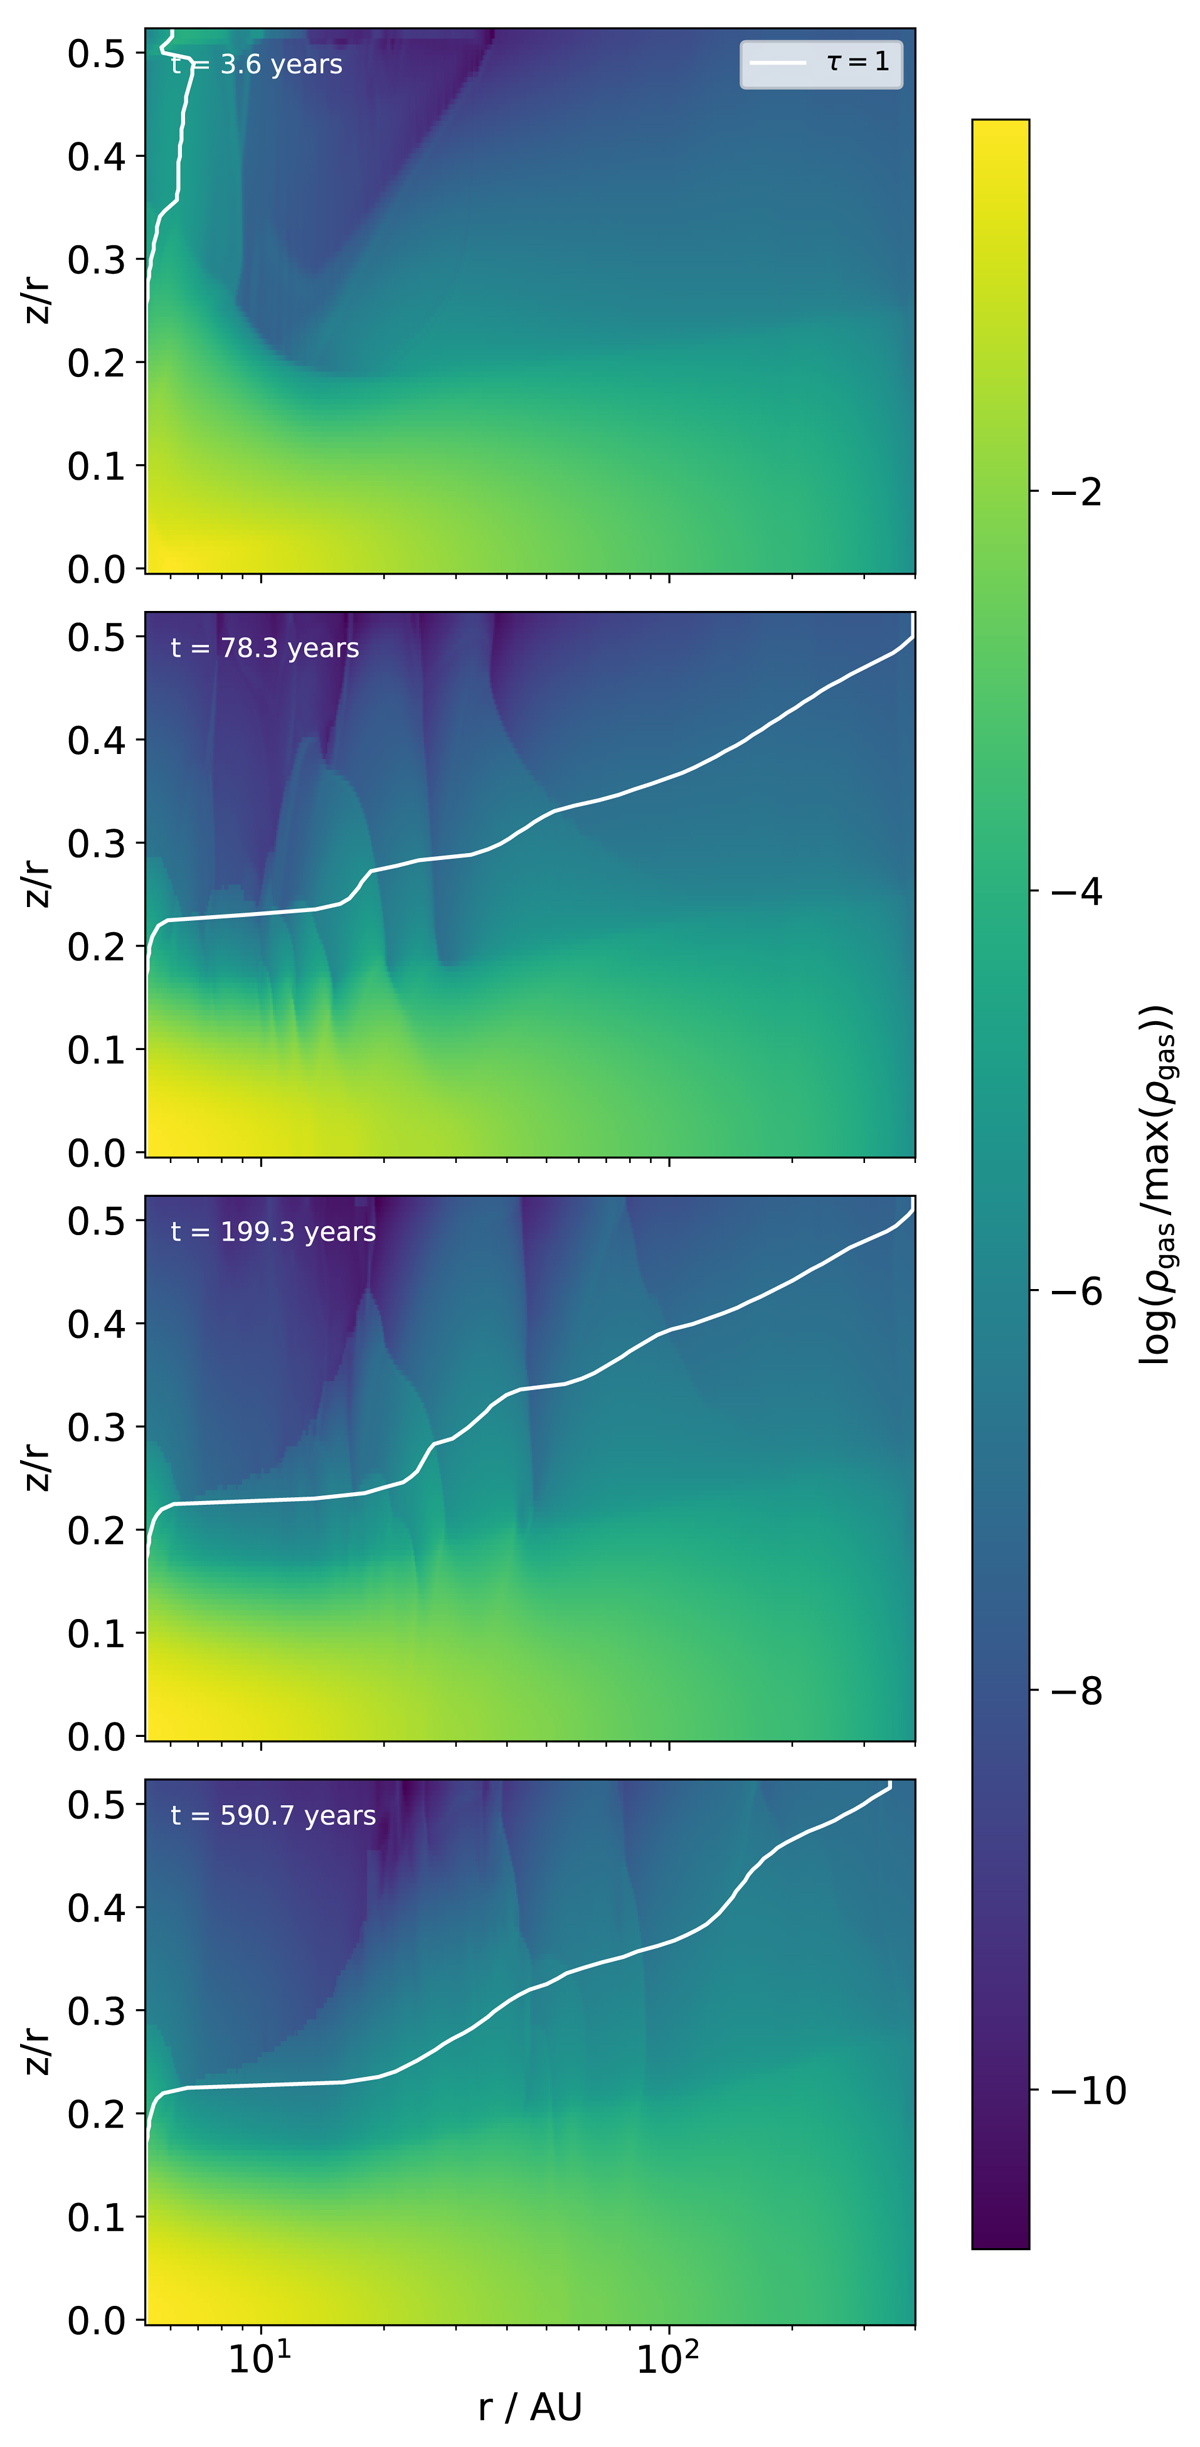
Density structure of the disk at different epochs after the start of the outburst. The horizontal axis is the radial coordinate in au. The vertical axis is π/2 − θ ≃ z/r. Stellar photons move horizontally in this plot. The color scale is logarithmic, normalized to the maximum density of the first image. The white line is the radial τ = 1 line at λ = 0.66 μm with scattering included. The albedo at this wavelength is 0.8. The radiation-hydrodynamics simulations, however, only use the absorption opacity.
Current usage metrics show cumulative count of Article Views (full-text article views including HTML views, PDF and ePub downloads, according to the available data) and Abstracts Views on Vision4Press platform.
Data correspond to usage on the plateform after 2015. The current usage metrics is available 48-96 hours after online publication and is updated daily on week days.
Initial download of the metrics may take a while.