Fig. 1.
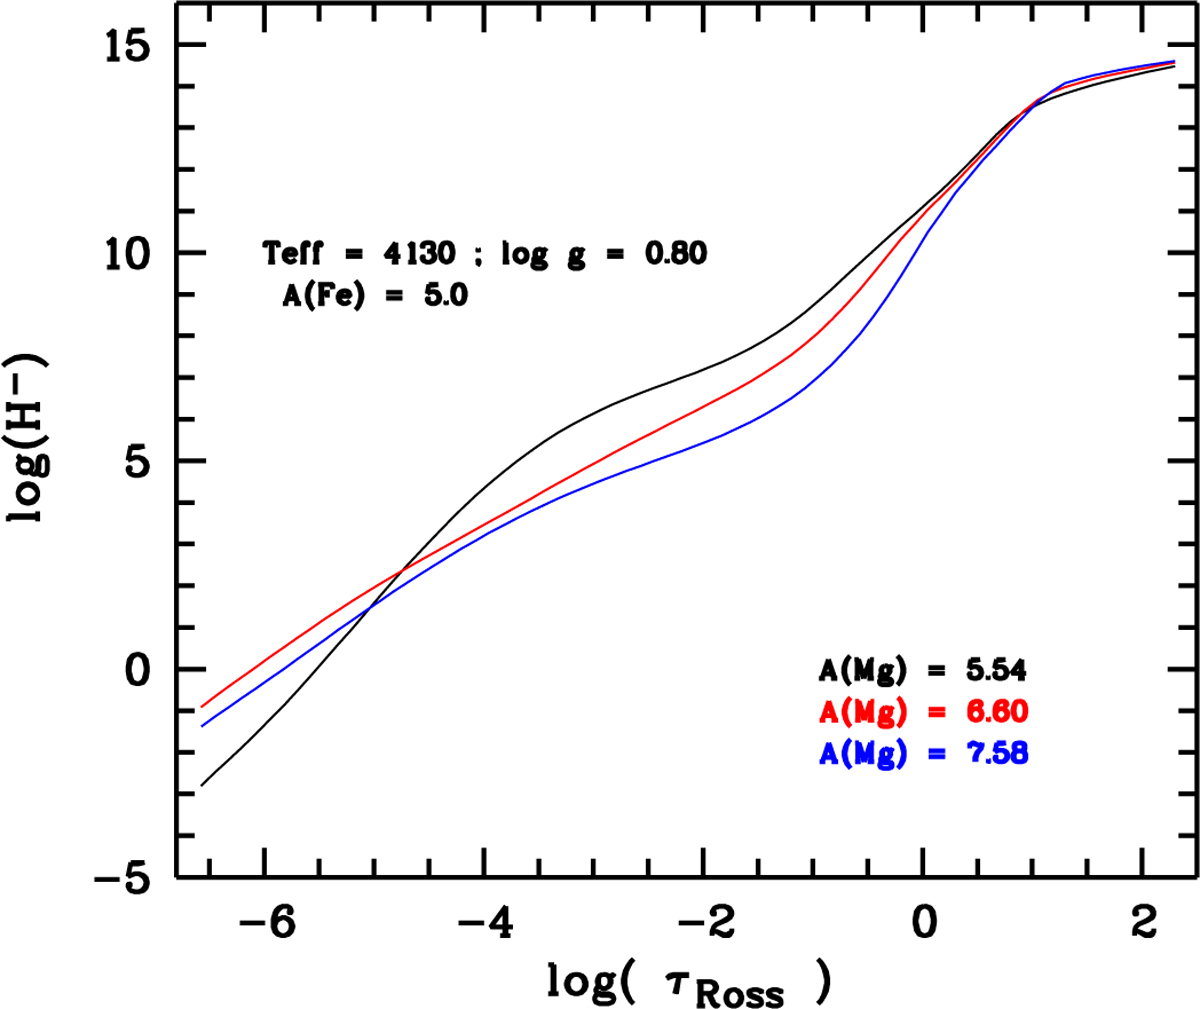
Number density of H− vs. optical depth log τRoss for three different abundances of Mg. The blue line (A(Mg) = 7.58) corresponds to the solar abundance of Mg, the red line to the Mg abundance in Pisces II 10694, and the black line (A(Mg) = 5.54) to the Mg abundance expected for a normal metal-poor star with [Fe/H] = −2.6. The molecular bands and the metallic lines are mainly formed between log τRoss = −2 and −1, a region where the number density of H− is strongly affected by the Mg abundance.
Current usage metrics show cumulative count of Article Views (full-text article views including HTML views, PDF and ePub downloads, according to the available data) and Abstracts Views on Vision4Press platform.
Data correspond to usage on the plateform after 2015. The current usage metrics is available 48-96 hours after online publication and is updated daily on week days.
Initial download of the metrics may take a while.