Open Access
Fig. 3.
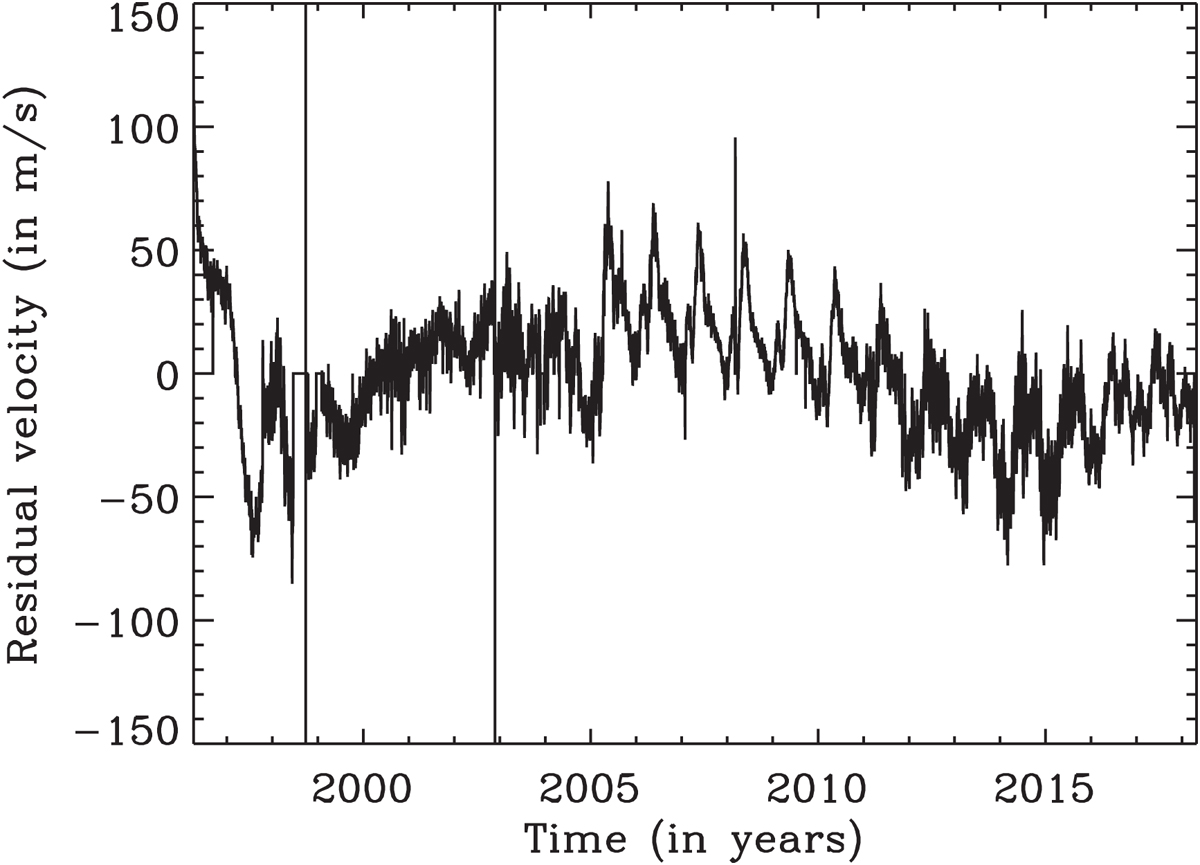
Velocity residuals for PM1 as a function of time: one point per day. The two vertical lines indicate when the modes of operation changed from blue wing to red wing and vice versa.
Current usage metrics show cumulative count of Article Views (full-text article views including HTML views, PDF and ePub downloads, according to the available data) and Abstracts Views on Vision4Press platform.
Data correspond to usage on the plateform after 2015. The current usage metrics is available 48-96 hours after online publication and is updated daily on week days.
Initial download of the metrics may take a while.