Fig. 1.
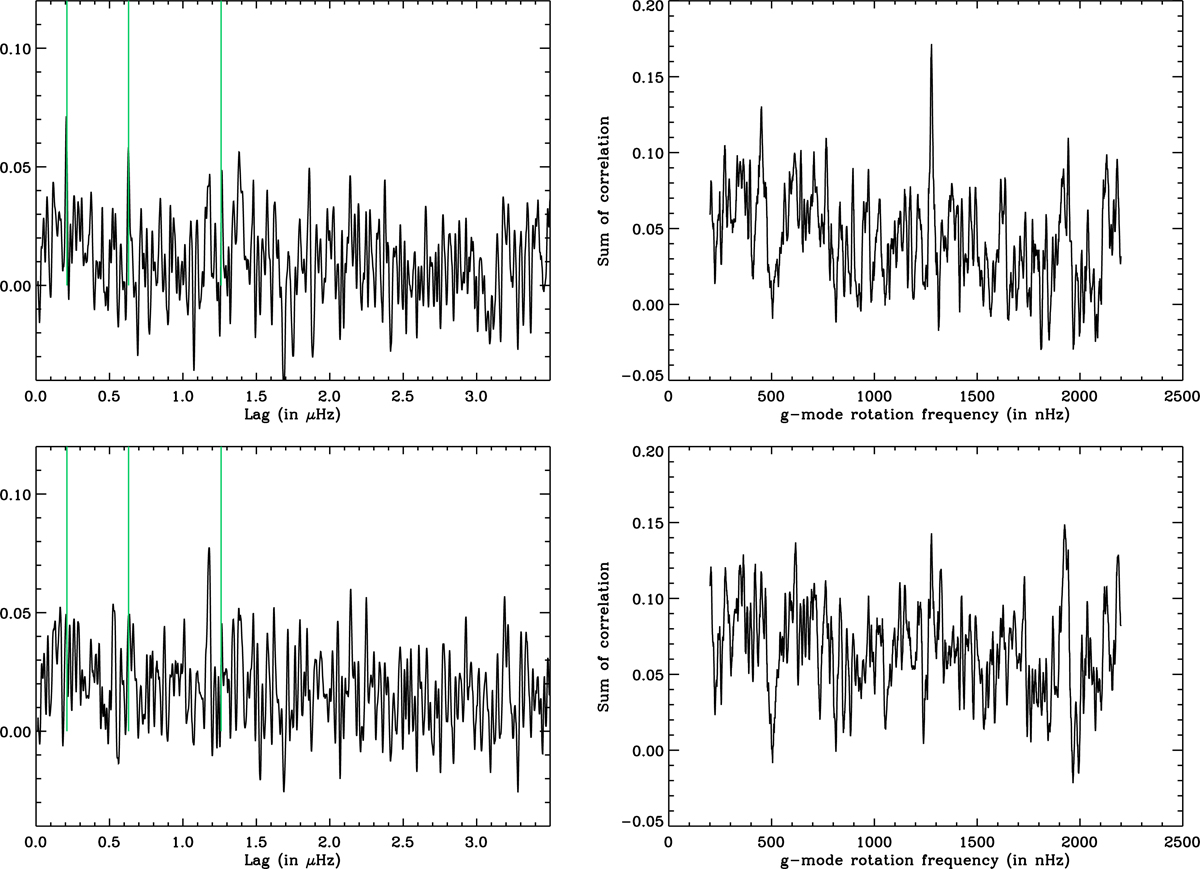
Left: correlation of the power spectrum as obtained by Fossat et al. (2017) as a function of frequency lag for two different time series sampled at 80 s (top) and 60 s (bottom); this is comparable to Fig. 10 of Fossat et al. (2017). The green vertical lines correspond to frequencies at 210 nHz, 630 nHz, and 1260 nHz. Right: sum of the correlation for l = 1 and l = 2 modes as obtained by Fossat et al. (2017) as a function of rotation frequency for two different time series sampled at 80 s (top) and 60 s (bottom); this is comparable to Fig. 16 of Fossat et al. (2017).
Current usage metrics show cumulative count of Article Views (full-text article views including HTML views, PDF and ePub downloads, according to the available data) and Abstracts Views on Vision4Press platform.
Data correspond to usage on the plateform after 2015. The current usage metrics is available 48-96 hours after online publication and is updated daily on week days.
Initial download of the metrics may take a while.