Fig. 1.
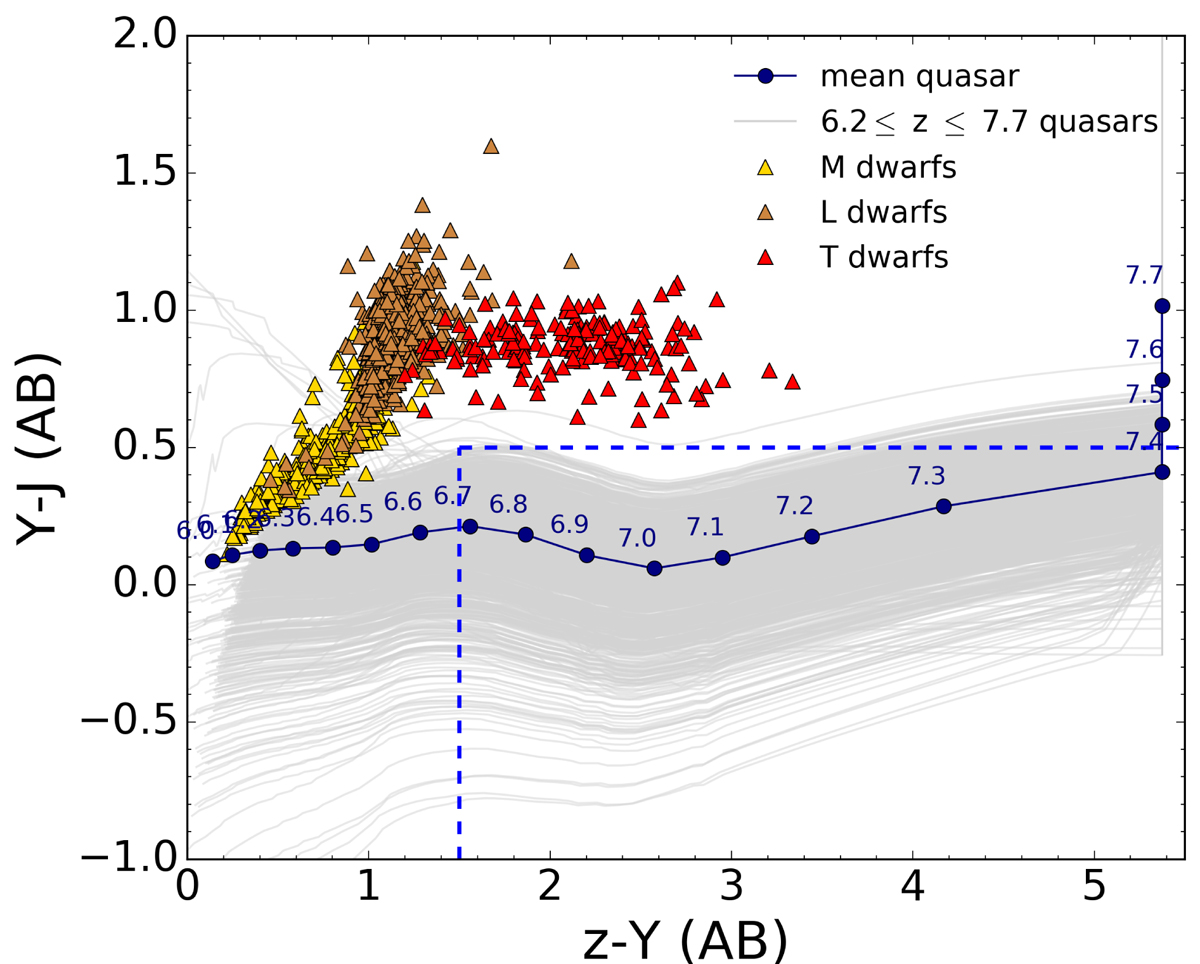
Diagram of (z − Y) vs. (Y − J) in the CFHT filters for simulated quasars and observed low-mass stars from the SpeX Prism library (triangles in yellow, brown, and red show M, L, and T dwarfs, respectively). The blue curve represents the colours of the mean quasar derived by Pâris et al. (2011) for which IGM absorption is included. The grey curves show the tracks in colour–colour space of the 1000 quasars red-shifted from z = 6.2 to z = 7.7. The blue dashed lines correspond to the colour criteria chosen to select quasars of redshift z ∼ 7.
Current usage metrics show cumulative count of Article Views (full-text article views including HTML views, PDF and ePub downloads, according to the available data) and Abstracts Views on Vision4Press platform.
Data correspond to usage on the plateform after 2015. The current usage metrics is available 48-96 hours after online publication and is updated daily on week days.
Initial download of the metrics may take a while.