Fig. 7.
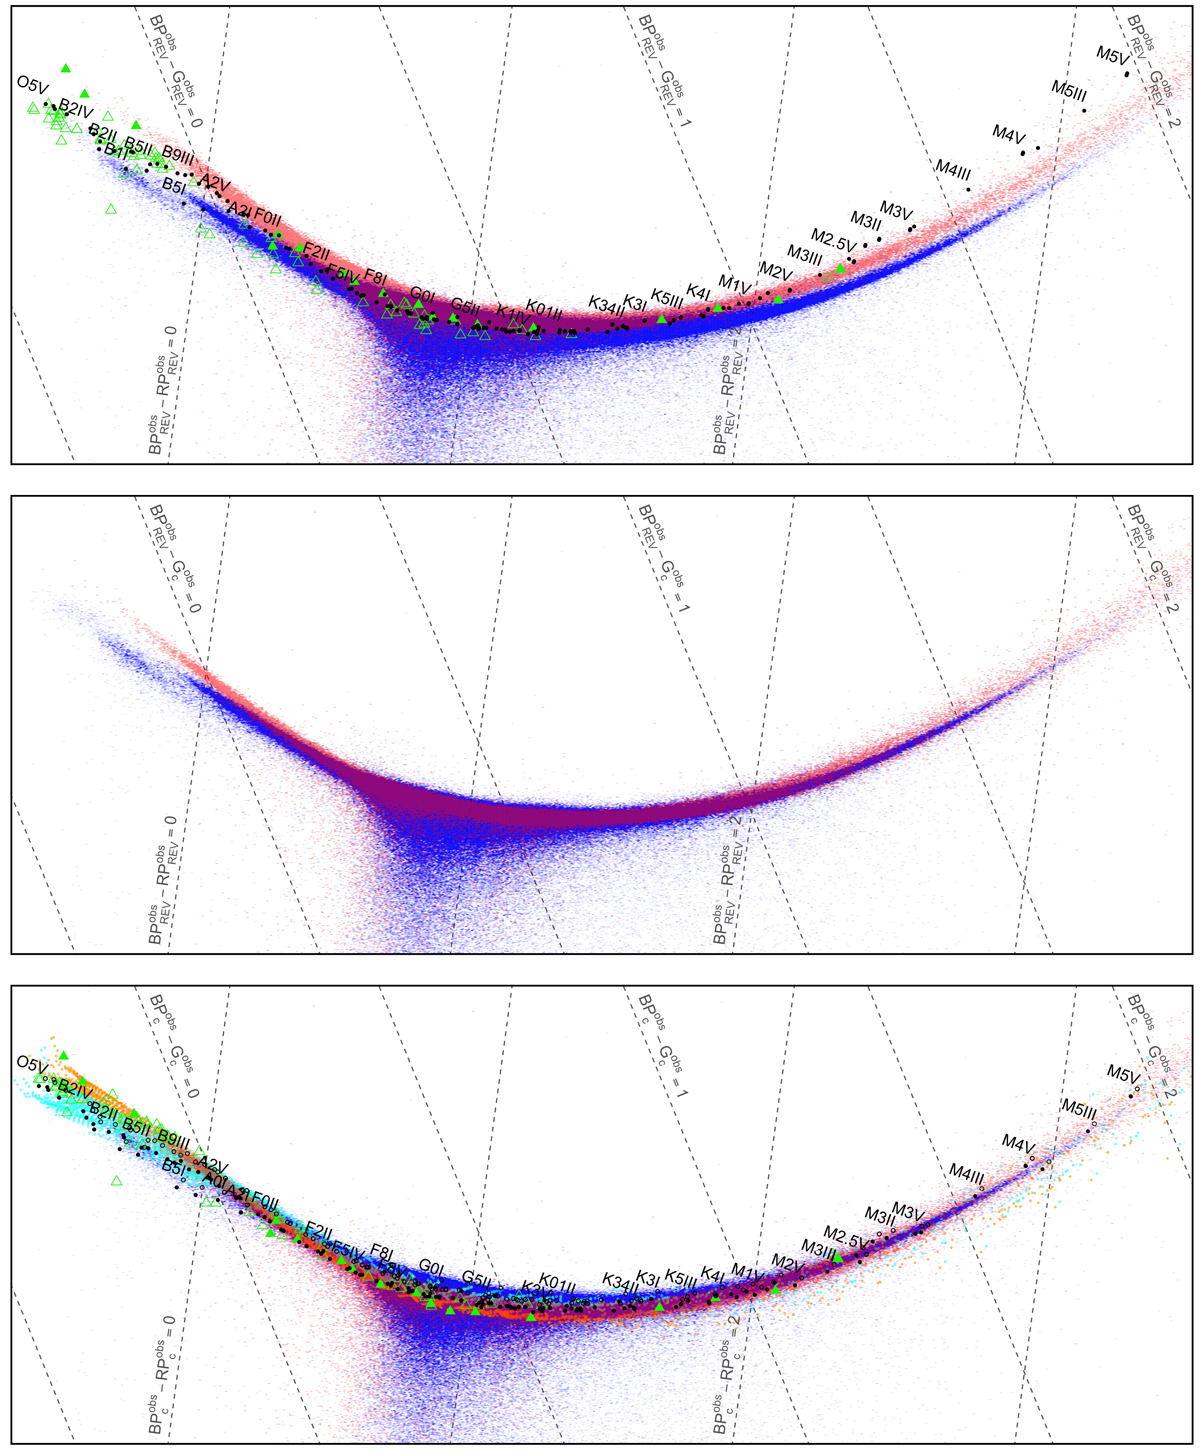
Colour–colour diagram for BP−RP versus BP−G, separated into the bright (red shades) and faint (blue shades) magnitude range. Top panel: REV passbands. The black dots indicate the positions of the Pickles spectra, the green triangles show the SPSS (filled symbols for bright, open symbols for faint range). Central panel: as top panel, but replacing the GREV magnitude by the Gc magnitude of this work. Bottom panel: same as top panel, but for the Gc, BPc, and RPc magnitudes of this work. The filled dots correspond to the Pickles spectra and the bright range BP passband, open dots for the BP passband for the faint magnitude range. The orange dots show the BaSeL spectra from the bright range, the cyan dots for the faint range. The original colour–colour diagram has been rotated by 30◦ clockwise and exaggerated in a vertical direction by a factor of 11 for better display. The dashed lines indicate the axis grid in BP−RP and BP−G.
Current usage metrics show cumulative count of Article Views (full-text article views including HTML views, PDF and ePub downloads, according to the available data) and Abstracts Views on Vision4Press platform.
Data correspond to usage on the plateform after 2015. The current usage metrics is available 48-96 hours after online publication and is updated daily on week days.
Initial download of the metrics may take a while.