Fig. 2.
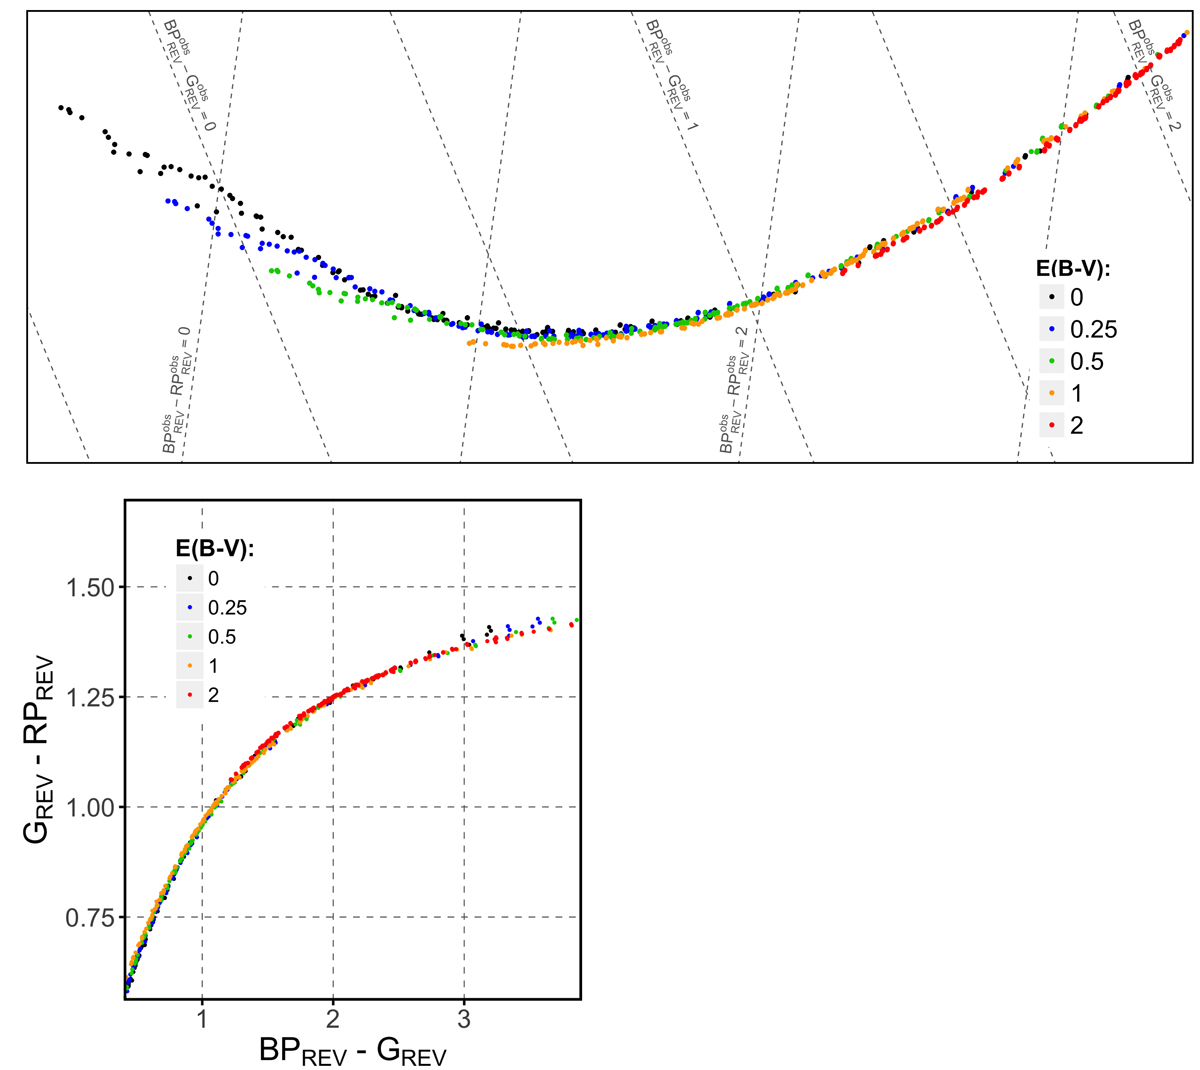
Position of stellar spectra by Pickles (1998) in colour–colour diagrams for different levels of interstellar reddening. Top panel: region of the BP−RP versus BP−G diagram considered in Sect. 5. The colour–colour diagram is rotated clockwise by 30◦ and exaggerated in the vertical direction by a factor 11. The dashed lines correspond to constant BP−RP and BP−G values. Left panel: red-end region of the BP−G versus G–RP diagram used in Sect. 6.
Current usage metrics show cumulative count of Article Views (full-text article views including HTML views, PDF and ePub downloads, according to the available data) and Abstracts Views on Vision4Press platform.
Data correspond to usage on the plateform after 2015. The current usage metrics is available 48-96 hours after online publication and is updated daily on week days.
Initial download of the metrics may take a while.