Fig. 10.
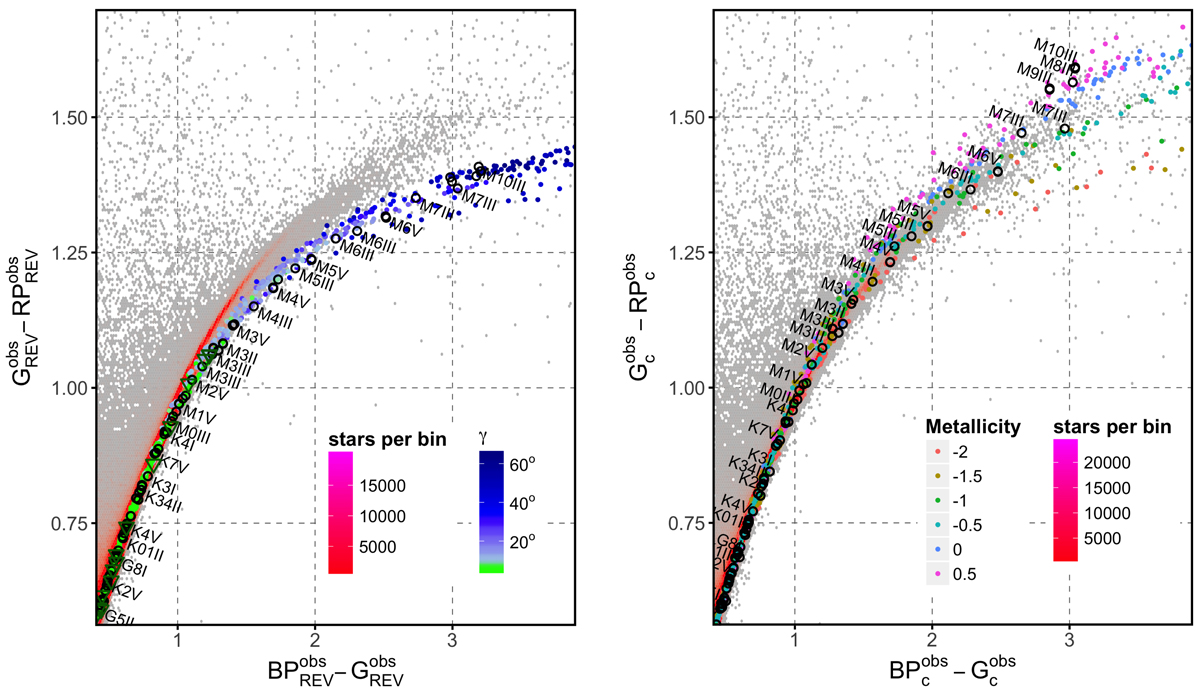
Left panel: colour–colour diagram for the REV passbands. The black circles indicate the positions of the Pickles spectra, the dark green triangles show the SPSS. The dots represent the BaSeL spectra, colour-coded according to the estimated γ angle. Right panel: same as left panel, but for the Gc, BPc, and RPc magnitudes of this work. The BaSeL spectra are shown for the faint magnitude range only, and are colour-coded according to the metallicity (in dex). Bins with numbers of stars lower than indicated in the colour bars are plotted in grey.
Current usage metrics show cumulative count of Article Views (full-text article views including HTML views, PDF and ePub downloads, according to the available data) and Abstracts Views on Vision4Press platform.
Data correspond to usage on the plateform after 2015. The current usage metrics is available 48-96 hours after online publication and is updated daily on week days.
Initial download of the metrics may take a while.