Fig. 5.
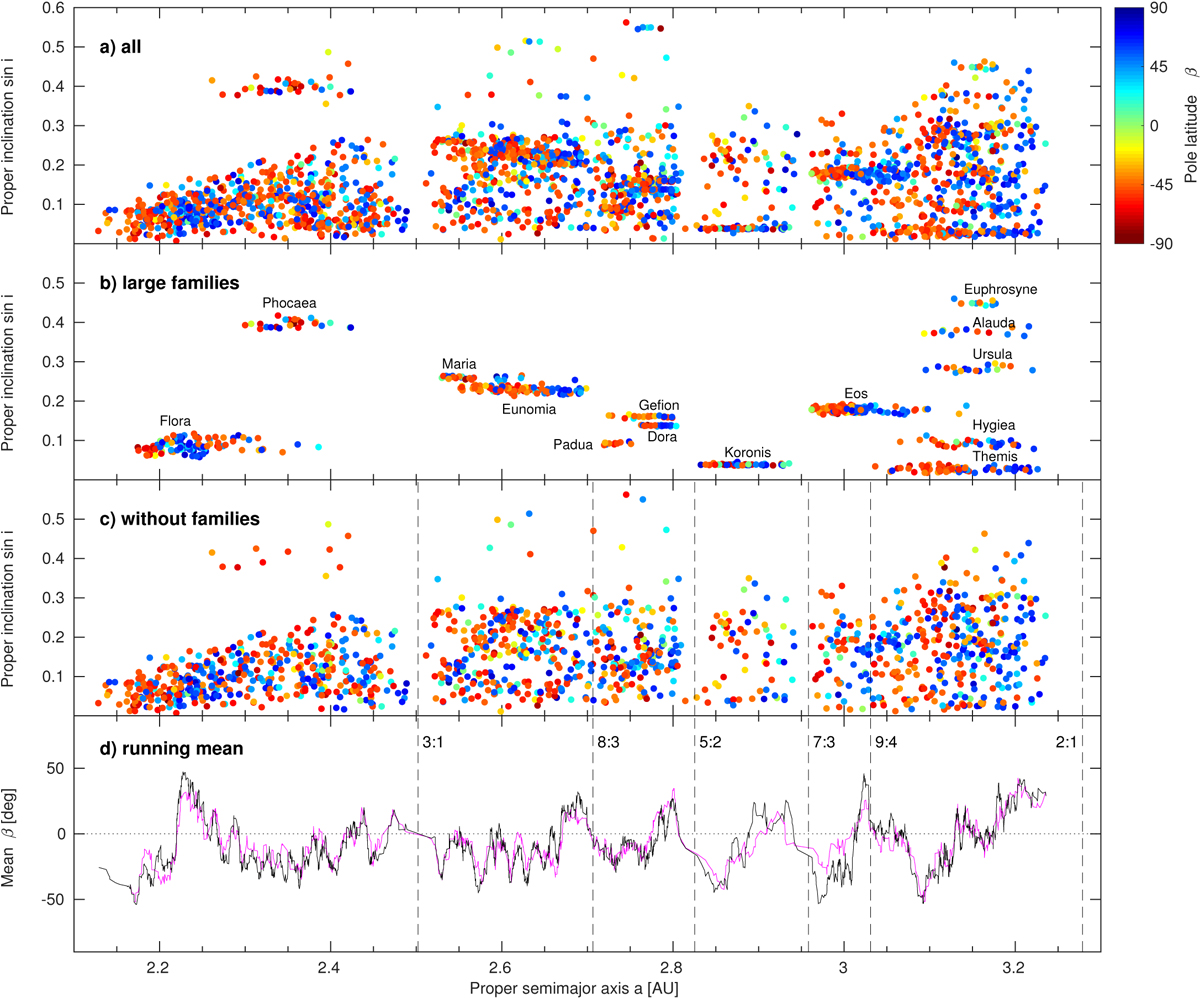
The distribution of pole latitude β for all models (panel a), asteroids in the largest families (panel b), and asteroids not in families (panel c). The bottom panel (panel d) shows the running mean of β over 20 asteroids (all asteroids – black, without families – magenta). The dashed vertical lines mark the strongest mean motion resonances.
Current usage metrics show cumulative count of Article Views (full-text article views including HTML views, PDF and ePub downloads, according to the available data) and Abstracts Views on Vision4Press platform.
Data correspond to usage on the plateform after 2015. The current usage metrics is available 48-96 hours after online publication and is updated daily on week days.
Initial download of the metrics may take a while.