Fig. 9
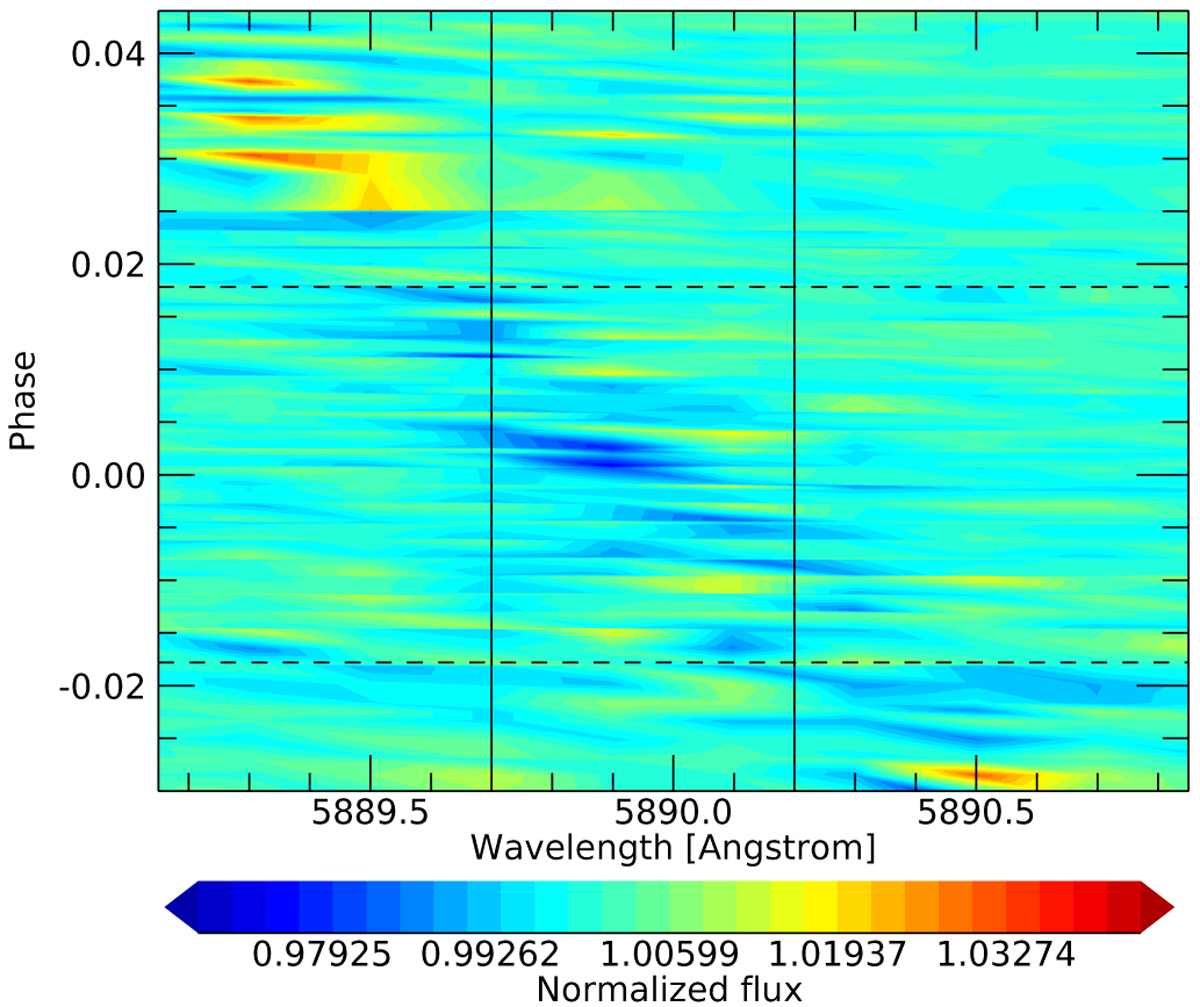
Tomography of the corrected sodium D2 line absorption. Horizontal dashed lines represent the phases of transit ingress and egress. Vertical lines represent a 0.5 Å passband centered on the D2 line: the transit inside this passband is shorter thanthe transit from ephemerides because the main signal is still in the stellar rest frame.
Current usage metrics show cumulative count of Article Views (full-text article views including HTML views, PDF and ePub downloads, according to the available data) and Abstracts Views on Vision4Press platform.
Data correspond to usage on the plateform after 2015. The current usage metrics is available 48-96 hours after online publication and is updated daily on week days.
Initial download of the metrics may take a while.