Fig. 8
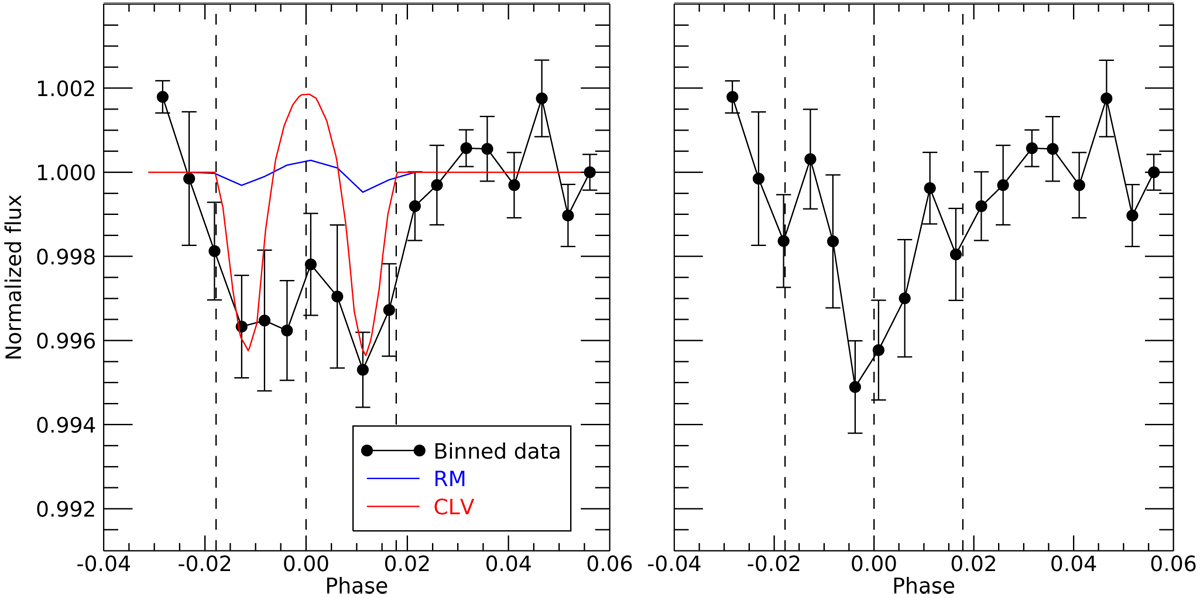
Transmission light curve of HD 189733b in the planetary rest frame from the three transits, centered on the sodium D2 and D1 lines (averaged), with bandpasses of 0.75 Å. Vertical dashed lines represent the beginning, middle, and end of the transit based on ephemerides. Left panel: before the corrections for stellar effects, which are overimposed. Right panel: after the correction for CLV- and RM-related effects.
Current usage metrics show cumulative count of Article Views (full-text article views including HTML views, PDF and ePub downloads, according to the available data) and Abstracts Views on Vision4Press platform.
Data correspond to usage on the plateform after 2015. The current usage metrics is available 48-96 hours after online publication and is updated daily on week days.
Initial download of the metrics may take a while.