Free Access
Fig. 1
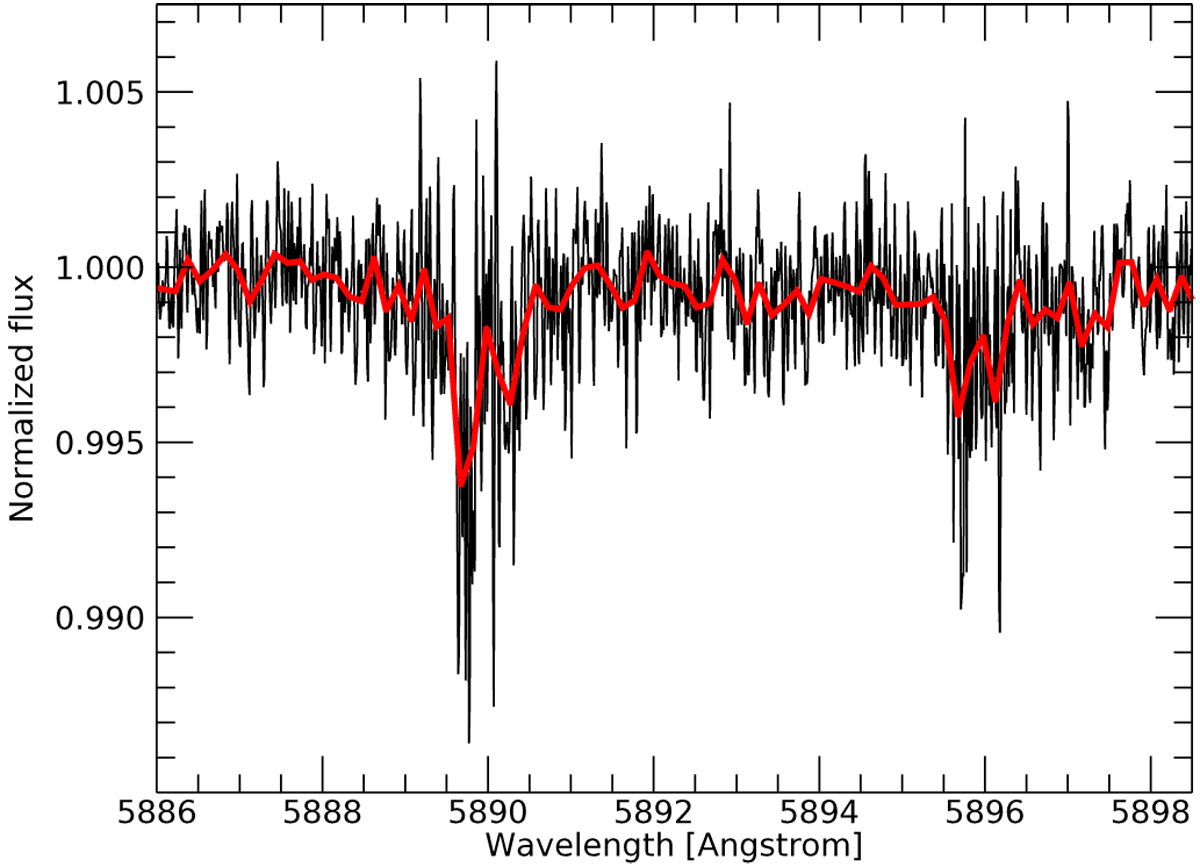
Sodium lines in the transmission spectrum of HD 189733b without correction for stellar effects. In red we overplot the binned spectrum, which shows the w-shaped profile of the sodium lines for illustration purposes.
Current usage metrics show cumulative count of Article Views (full-text article views including HTML views, PDF and ePub downloads, according to the available data) and Abstracts Views on Vision4Press platform.
Data correspond to usage on the plateform after 2015. The current usage metrics is available 48-96 hours after online publication and is updated daily on week days.
Initial download of the metrics may take a while.