Fig. 4.
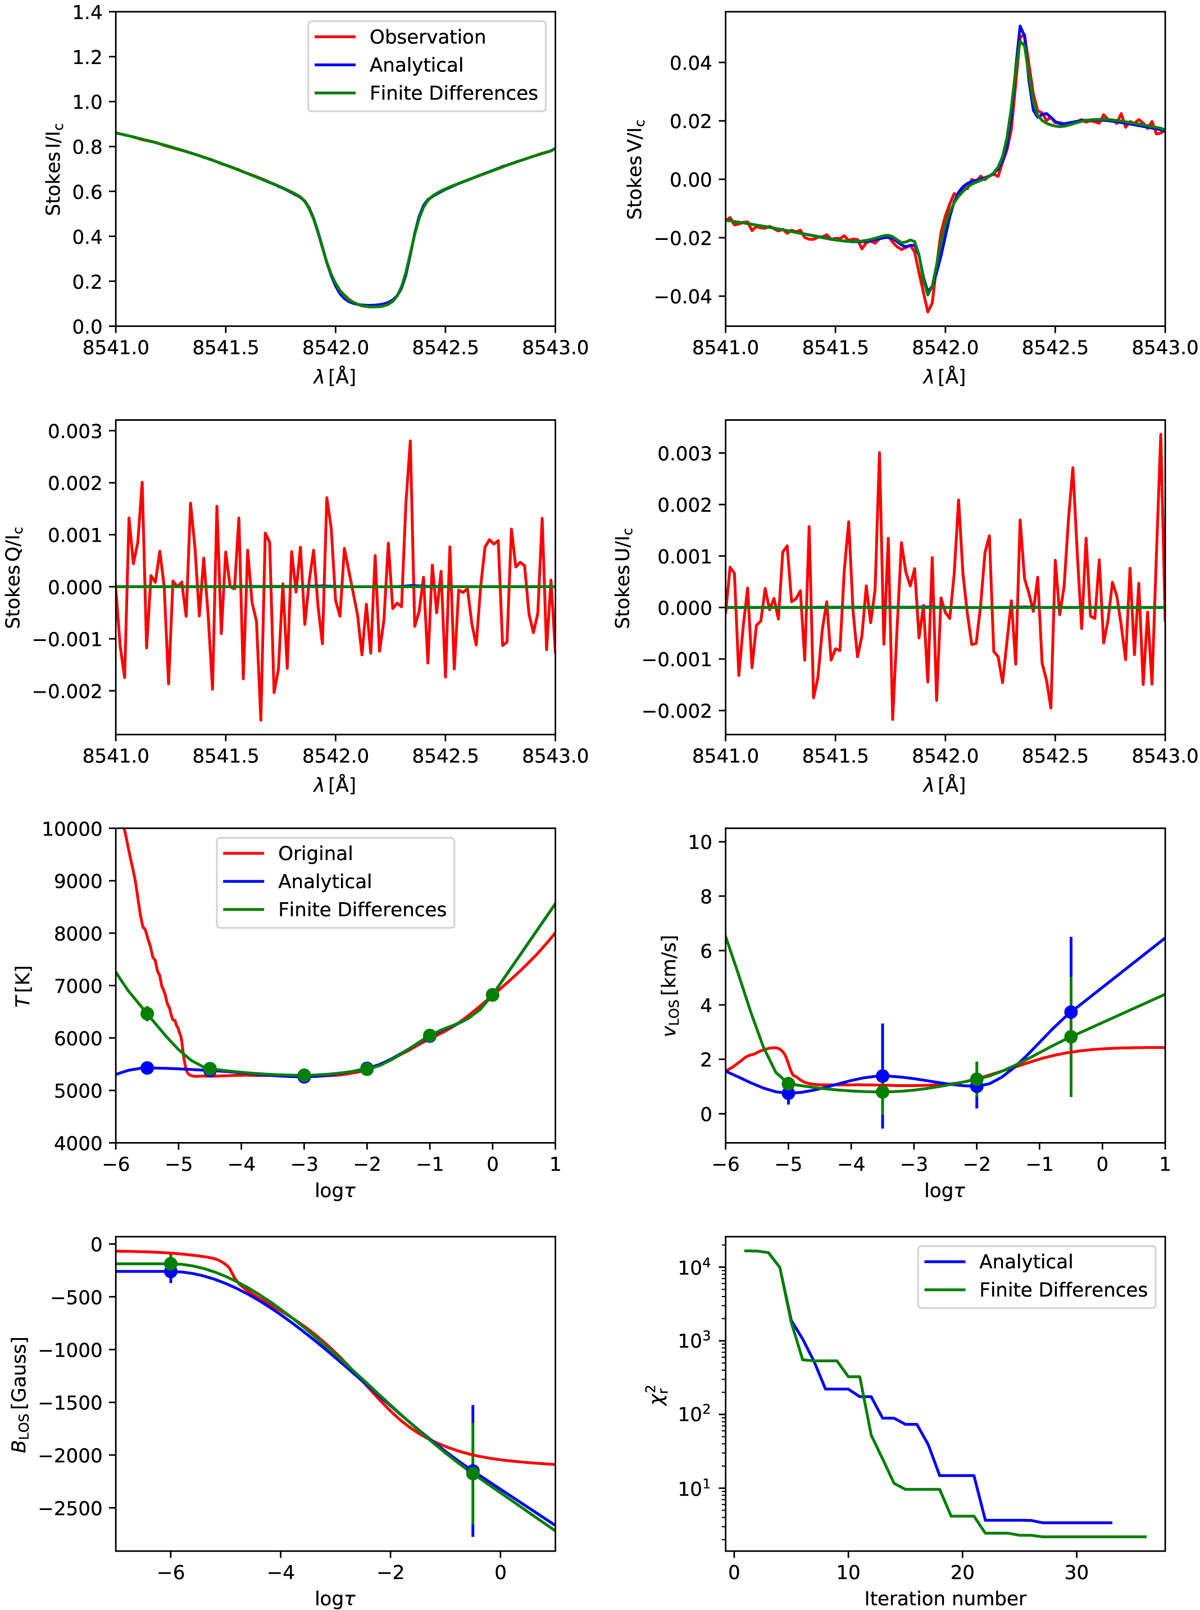
Comparison of an inversion of noisy synthetic data using SNAPI, relying on analytical and finite-difference response functions. The uppermost four panels show the agreement between the original and the fitted spectra. The next three panels show the inferred stratifications of temperature, LOS velocity, and LOS magnetic field and the comparison with the original stratification from the MHD cube. The error bars are plotted three times larger for clarity. Finally, the lower right panel shows the convergence comparison between inversions that use analytical and finite-differences response functions.
Current usage metrics show cumulative count of Article Views (full-text article views including HTML views, PDF and ePub downloads, according to the available data) and Abstracts Views on Vision4Press platform.
Data correspond to usage on the plateform after 2015. The current usage metrics is available 48-96 hours after online publication and is updated daily on week days.
Initial download of the metrics may take a while.