Fig. 2
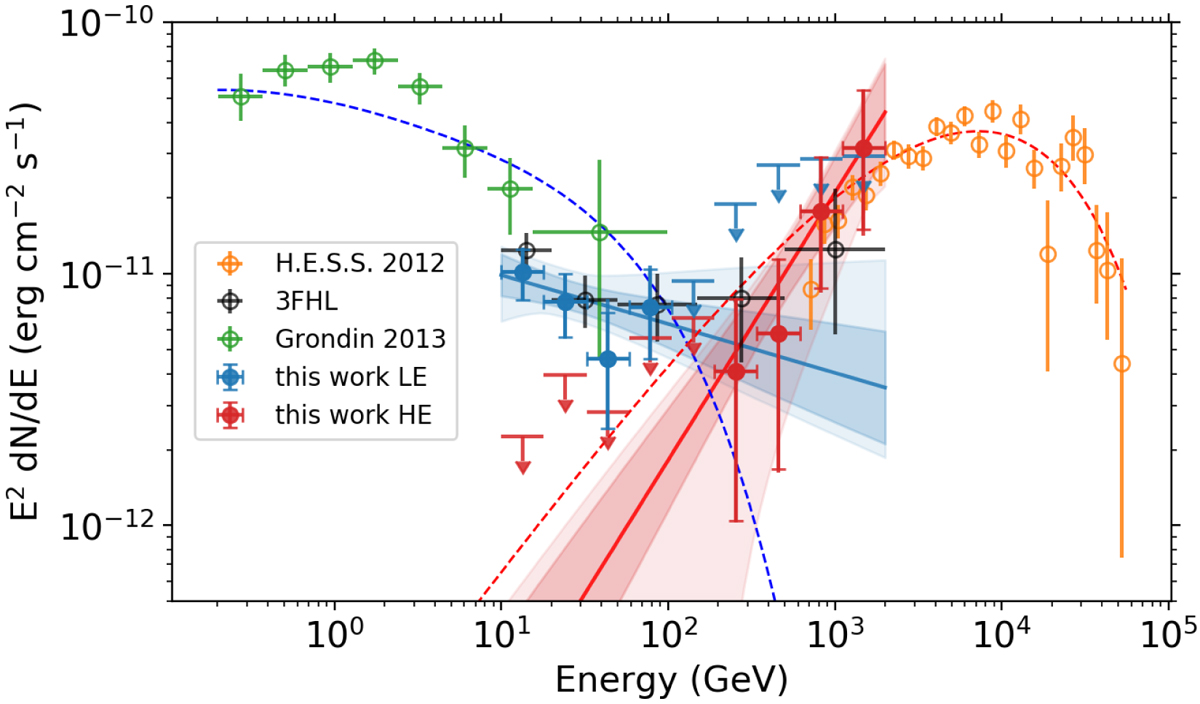
Spectral energy distribution (SED) of Vela X. We show separately the spectra for the low-energy (LE) and high-energy (HE) components as derived in this work. The lines and shaded bands show the best-fit power laws for each component with their uncertainties, based on the fit using model A. The darker shaded band corresponds to 68% statistical uncertainties only, while the lighter shaded band corresponds to the sum in quadrature of statistical uncertainties and systematic uncertainties from the morphological representation of the sources (models B and C) and the LAT effective area (see Sect. 2.3 for details). The points and 95% confidence level upper limits show the binned SED. For points, capped error bars show the 68% statistical uncertainties only, while the uncapped error bars show the sum in quadrature of statistical uncertainties and systematic uncertainties. Upper limits include systematic uncertainties as well. We also show the overall SEDs of Vela X from H.E.S.S. (Abramowski et al. 2012), from the LAT measurements < 100 GeV (Grondin et al. 2013), and from the 3FHL catalog (Ajello et al. 2017). The dashed lines show the predictions of the radiative model described in Sect. 3.
Current usage metrics show cumulative count of Article Views (full-text article views including HTML views, PDF and ePub downloads, according to the available data) and Abstracts Views on Vision4Press platform.
Data correspond to usage on the plateform after 2015. The current usage metrics is available 48-96 hours after online publication and is updated daily on week days.
Initial download of the metrics may take a while.