Fig. 1
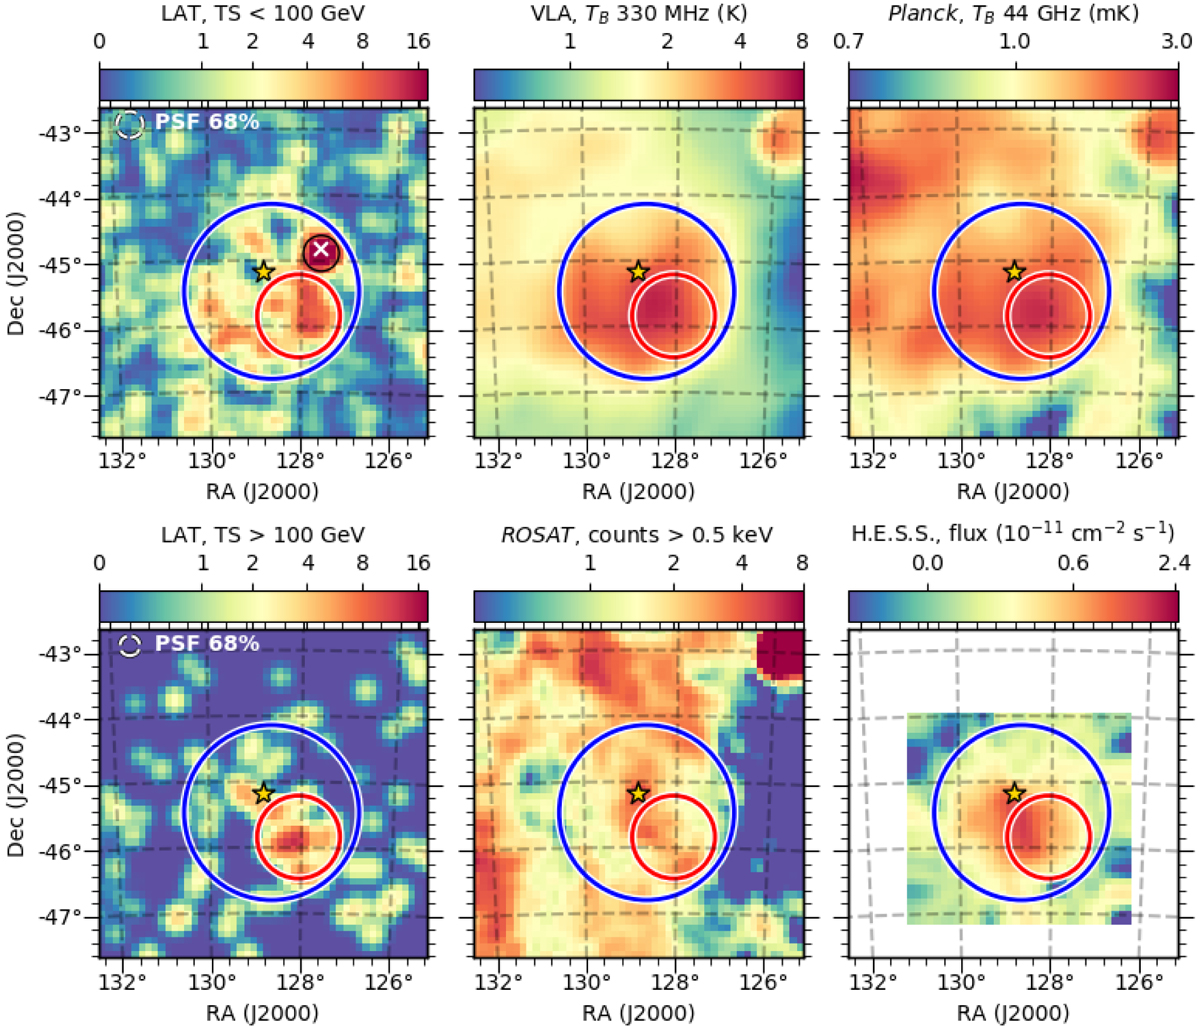
Multiwavelength maps of analysis region. The LAT TS maps for energies below and above 100 GeV are derived as described in Sect. 2.2. The VLA map at330 MHz is reproduced from Frail et al. (1997), the H.E.S.S. map for energies > 750 GeV from Abramowski et al. (2012). We also show maps at 44 GHz from the Planck survey (Planck Collaboration I 2016), and at X-rayenergies >0.5 keV from the ROSAT survey (Voges et al. 1999). The blue and red circles show the best-fit disks that account for Vela X in LAT data at energies <100 and > 100 GeV, respectively (Sect. 2.2). The star shows the position of the Vela pulsar. The black circle in the top left plot corresponds to the source FGES J0830.3−4453 (Ackermann et al. 2017), while the white cross shows the position of the source PS J0830.4−4449 found inour analysis. We note that for the LAT maps all sources other than Vela X and FGES J0830.3−4453/PS J0830.4−4449, including the Vela pulsar, were accounted for in the background model. All maps are reprojected onto the same grid as the gamma-ray images. Furthermore, they are smoothed for display to a common resolution of 0.°15. In the top left corner of the LAT maps we show the effective PSF 68% containment circle in the corresponding energy range for a power-law spectral distribution with index 2.
Current usage metrics show cumulative count of Article Views (full-text article views including HTML views, PDF and ePub downloads, according to the available data) and Abstracts Views on Vision4Press platform.
Data correspond to usage on the plateform after 2015. The current usage metrics is available 48-96 hours after online publication and is updated daily on week days.
Initial download of the metrics may take a while.