Fig. 10.
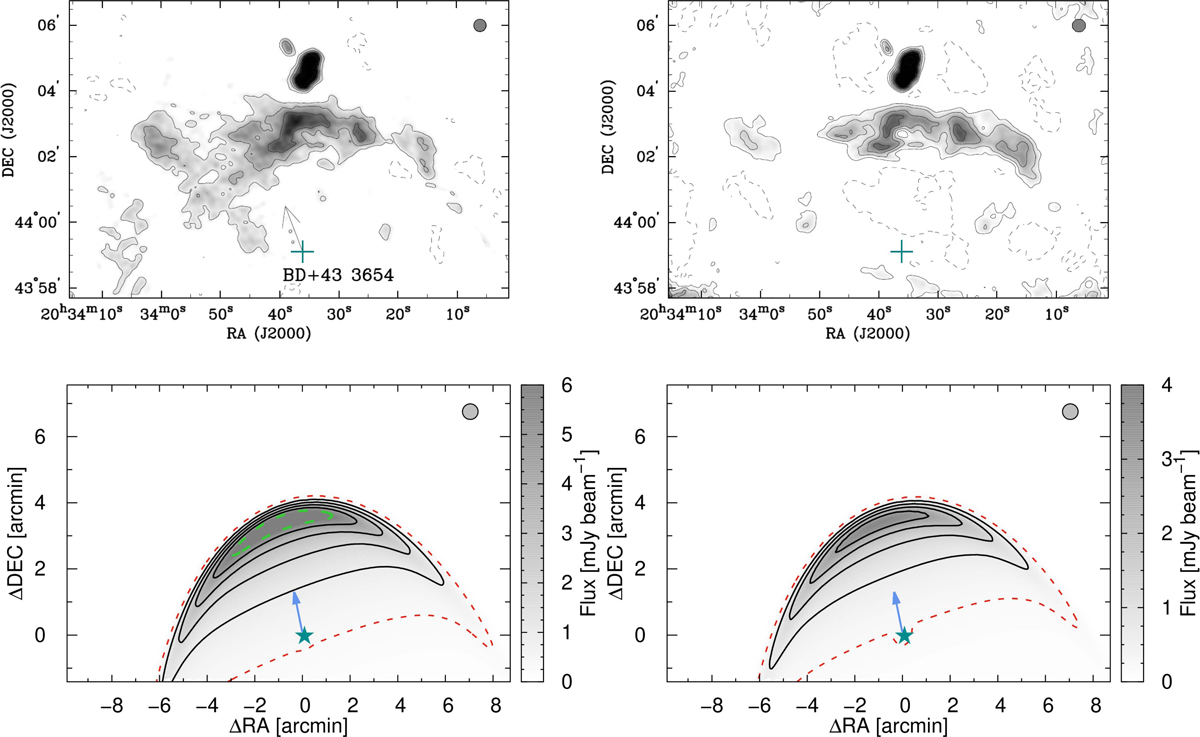
Comparison between the observed radio emission maps taken from (Benaglia et al. 2010; top panel) and our synthetic maps (bottom panel). Top right panel: synthesised beam of 12 arcsec × 12 arcsec is shown (i.e. σx = σy = 12 arcsec). Left and right panels: observing frequency of 1.42 GHz and 4.86 GHz, respectively. The rms levels of the observed maps are 0.3 mJy beam−1 (left panels) and 0.2 mJy beam−1 (right panels). The black solid contours of the 1.42 GHz maps are at 0.9,1.8, 3.0, and 4.5 mJy beam−1, the red dotted contour is at 0.3 mJy beam−1 (the observed map rms), and the green contour is at 6 mJy beam−1 (above the observed values). In the 4.86 GHz maps, the black contours are at 0.6, 1.2, 2.0, and 3.0 mJy beam−1, and the red dotted is at 0.2 mJy beam−1 (the observed map rms). A projection factor cos (Dec) was used for the x-coordinates in the synthetic map in order to relate the synthetic map units to sky positions.
Current usage metrics show cumulative count of Article Views (full-text article views including HTML views, PDF and ePub downloads, according to the available data) and Abstracts Views on Vision4Press platform.
Data correspond to usage on the plateform after 2015. The current usage metrics is available 48-96 hours after online publication and is updated daily on week days.
Initial download of the metrics may take a while.