Fig. 7
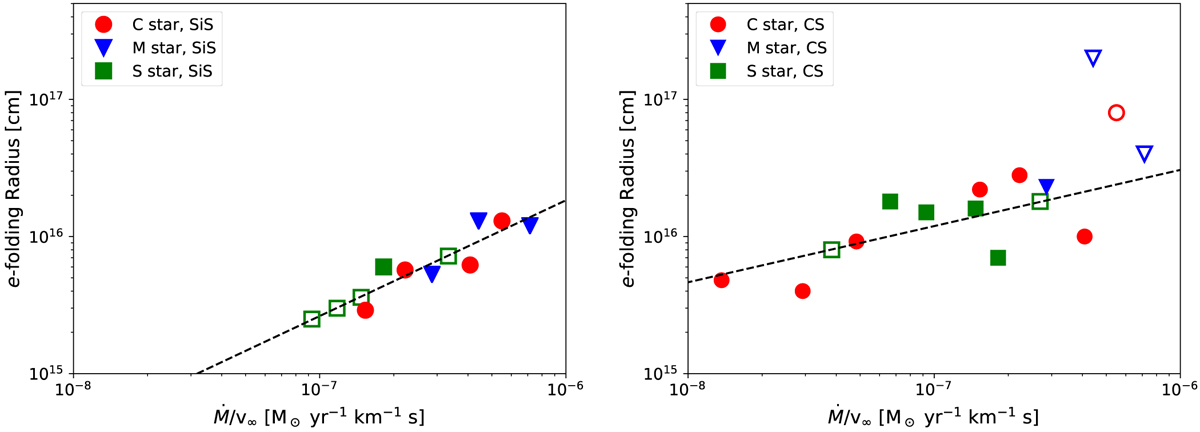
e-folding radii of SiS (left panel) and CS (right panel) plotted against stellar wind density, given by the mass-loss rate divided by the terminalexpansion velocity. The dashed lines show the best fit to the results, excluding the unfilled points, for which Re is derived from the best fit relation, or which do not have well-constrained Re for CS. See text for details.
Current usage metrics show cumulative count of Article Views (full-text article views including HTML views, PDF and ePub downloads, according to the available data) and Abstracts Views on Vision4Press platform.
Data correspond to usage on the plateform after 2015. The current usage metrics is available 48-96 hours after online publication and is updated daily on week days.
Initial download of the metrics may take a while.