Fig. 2
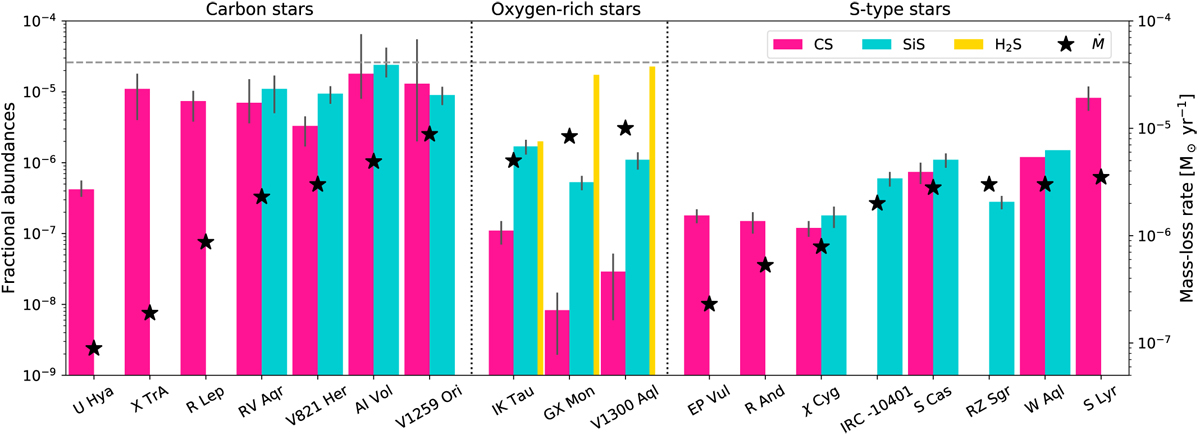
Abundances of CS and SiS with uncertainties for the carbon-rich stars (left panel), the S-type stars (right panel), and including H 2 S abundances from Danilovich et al. (2017 assuming an ortho-to-para ratio of three) for the oxygen-rich stars (middle panel). Fractional abundances relative to H2 are given by the left vertical axis and mass-loss rates are indicated by the black stars and the right vertical axis. The dashed, grey, horizontal line represents the maximum sulphur abundance expected based on the Asplund et al. (2009) solar abundance.
Current usage metrics show cumulative count of Article Views (full-text article views including HTML views, PDF and ePub downloads, according to the available data) and Abstracts Views on Vision4Press platform.
Data correspond to usage on the plateform after 2015. The current usage metrics is available 48-96 hours after online publication and is updated daily on week days.
Initial download of the metrics may take a while.