Fig. 1.
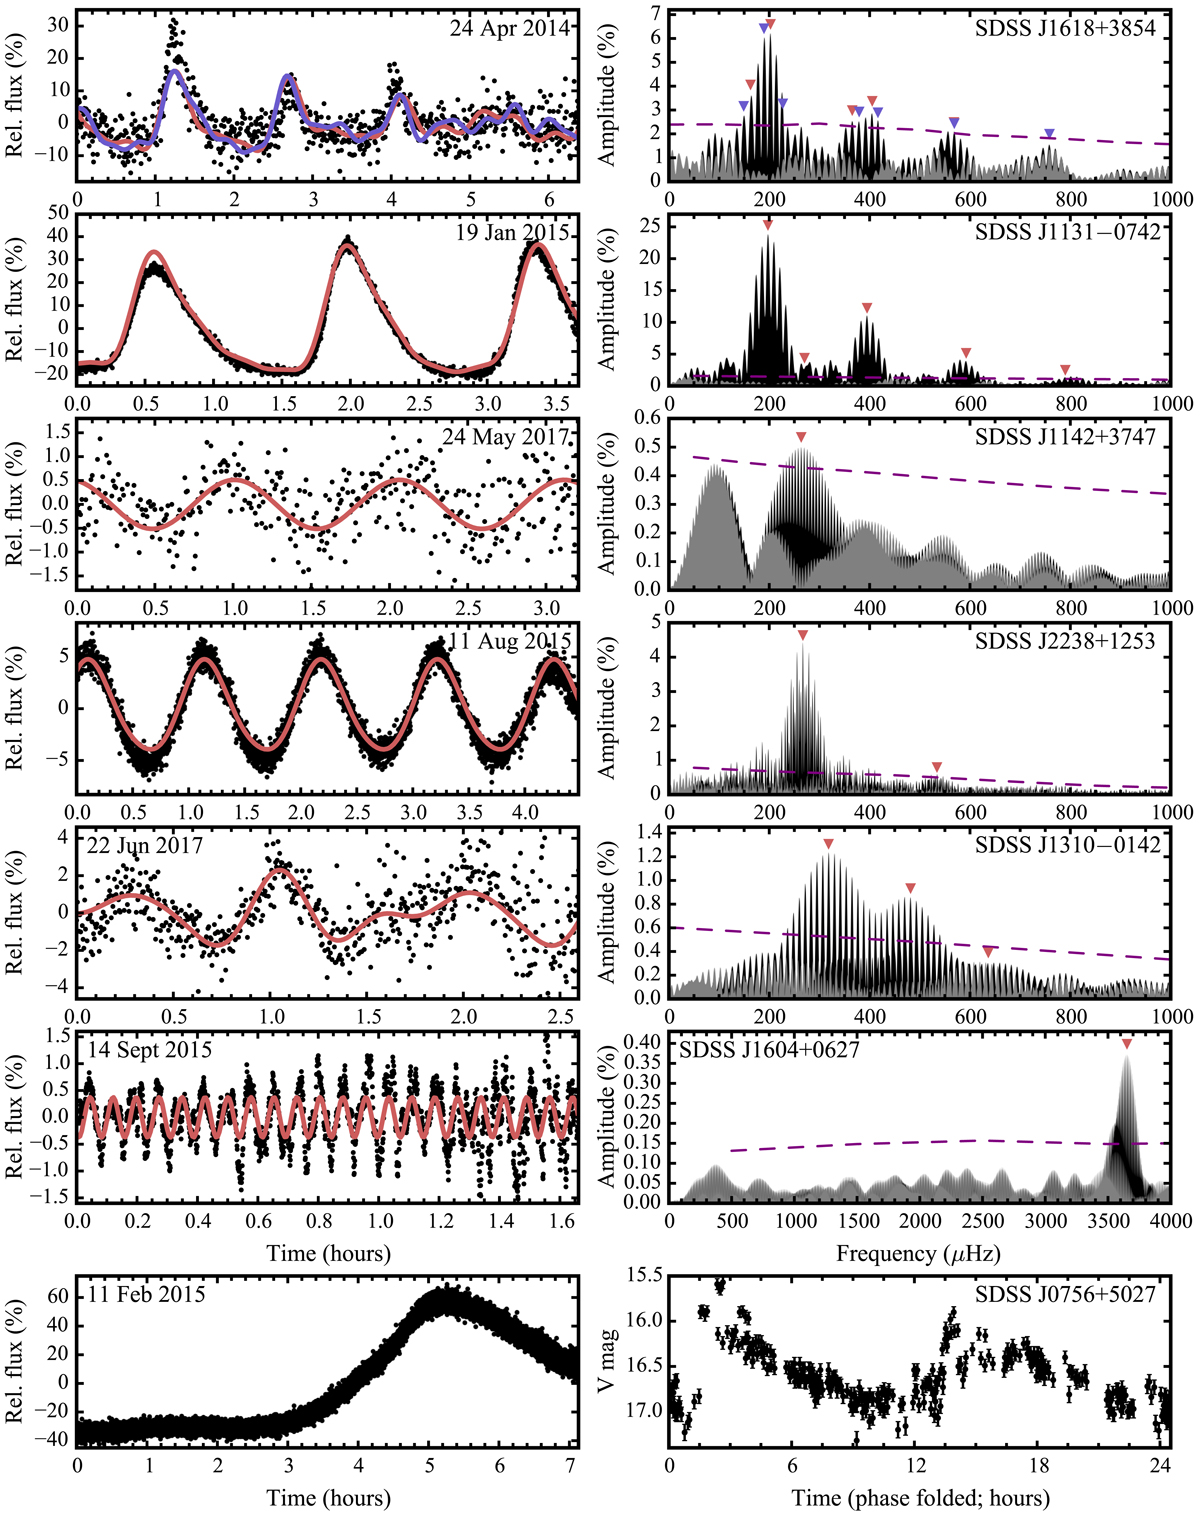
Photometric signatures of pulsations in seven new pulsating sdA stars. Left panels: portions of the McDonald light curves. Top six righthand panels: FTs of data subsets (see text). Frequencies in our adopted solutions are indicated with triangles in the FTs, and the corresponding best fits are plotted over the light curves. The two frequency solutions for SDSS J1618+3854 (see text) are color-coded. Final significance thresholds are marked with dashed lines, and the FTs of the final residuals are displayed in gray. The light curve of SDSS J1604+0627 is smoothed over ten points to guide the eye. Our McDonald photometry of SDSS J0756+5027 does not cover a full pulsation period, so we plot V-band data from the Catalina Sky Survey (see text), folded on twice the dominant period of 12.263 h, in the bottom right panel.
Current usage metrics show cumulative count of Article Views (full-text article views including HTML views, PDF and ePub downloads, according to the available data) and Abstracts Views on Vision4Press platform.
Data correspond to usage on the plateform after 2015. The current usage metrics is available 48-96 hours after online publication and is updated daily on week days.
Initial download of the metrics may take a while.