Free Access
Fig. 4.
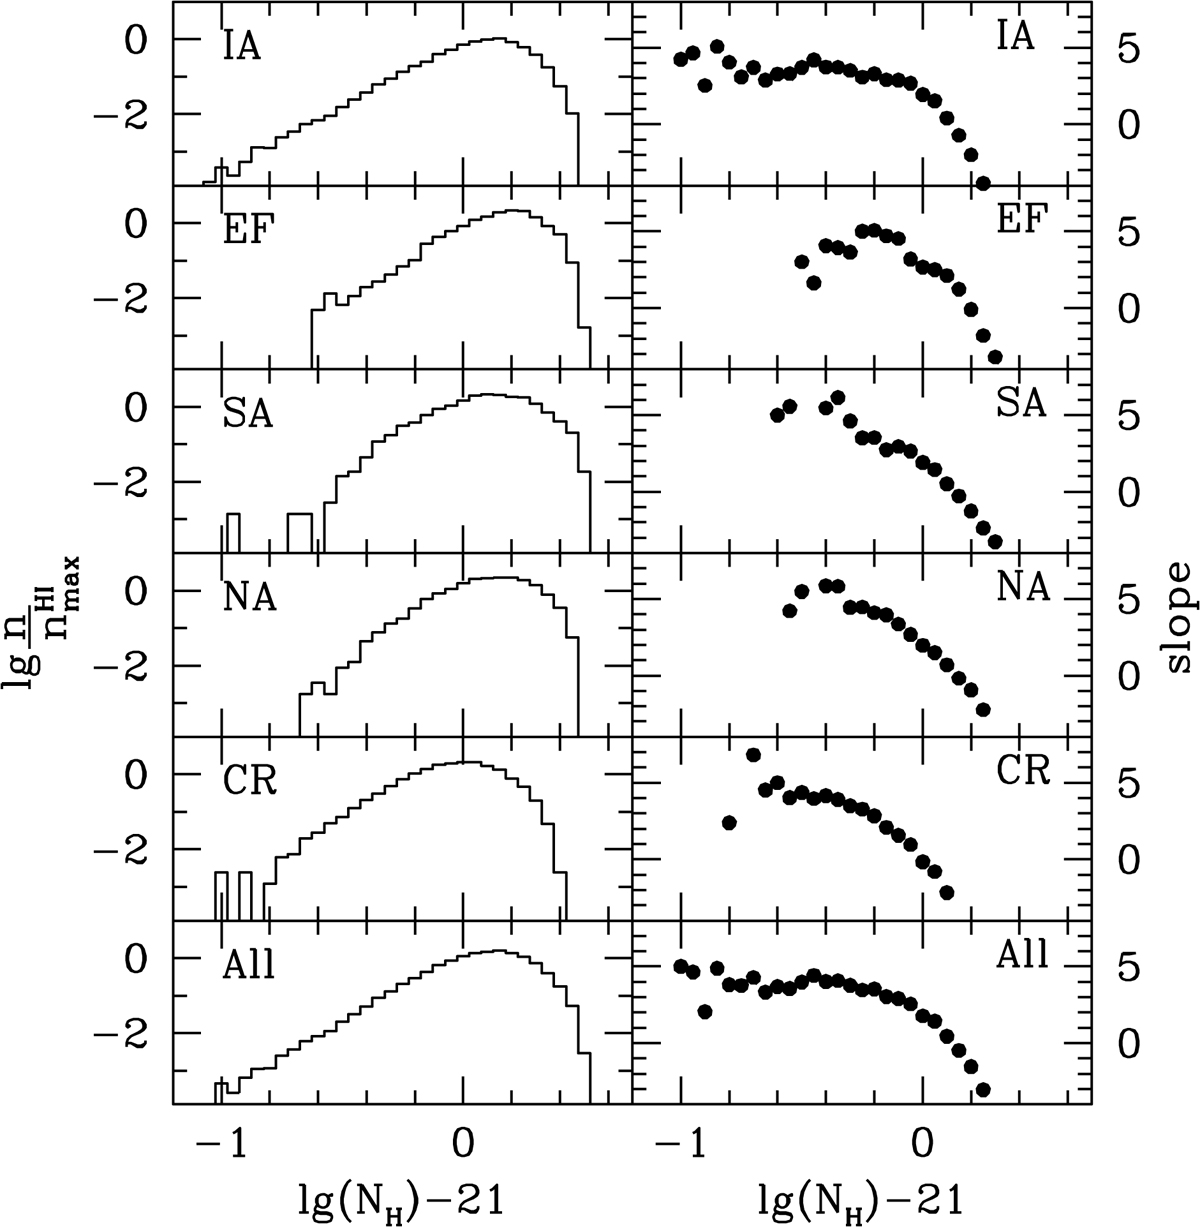
PDF (left panels) and the local PDF slope (right panels) of the HI column density in and around the population of GMCs in the whole disk of M 33 (labeled All, bottom panel), in the four selected regions (intermediate panels), and in the interarm (top panel), labeled as in Sect. 2.3 and in the caption of Fig. 2.
Current usage metrics show cumulative count of Article Views (full-text article views including HTML views, PDF and ePub downloads, according to the available data) and Abstracts Views on Vision4Press platform.
Data correspond to usage on the plateform after 2015. The current usage metrics is available 48-96 hours after online publication and is updated daily on week days.
Initial download of the metrics may take a while.