Fig. A.7.
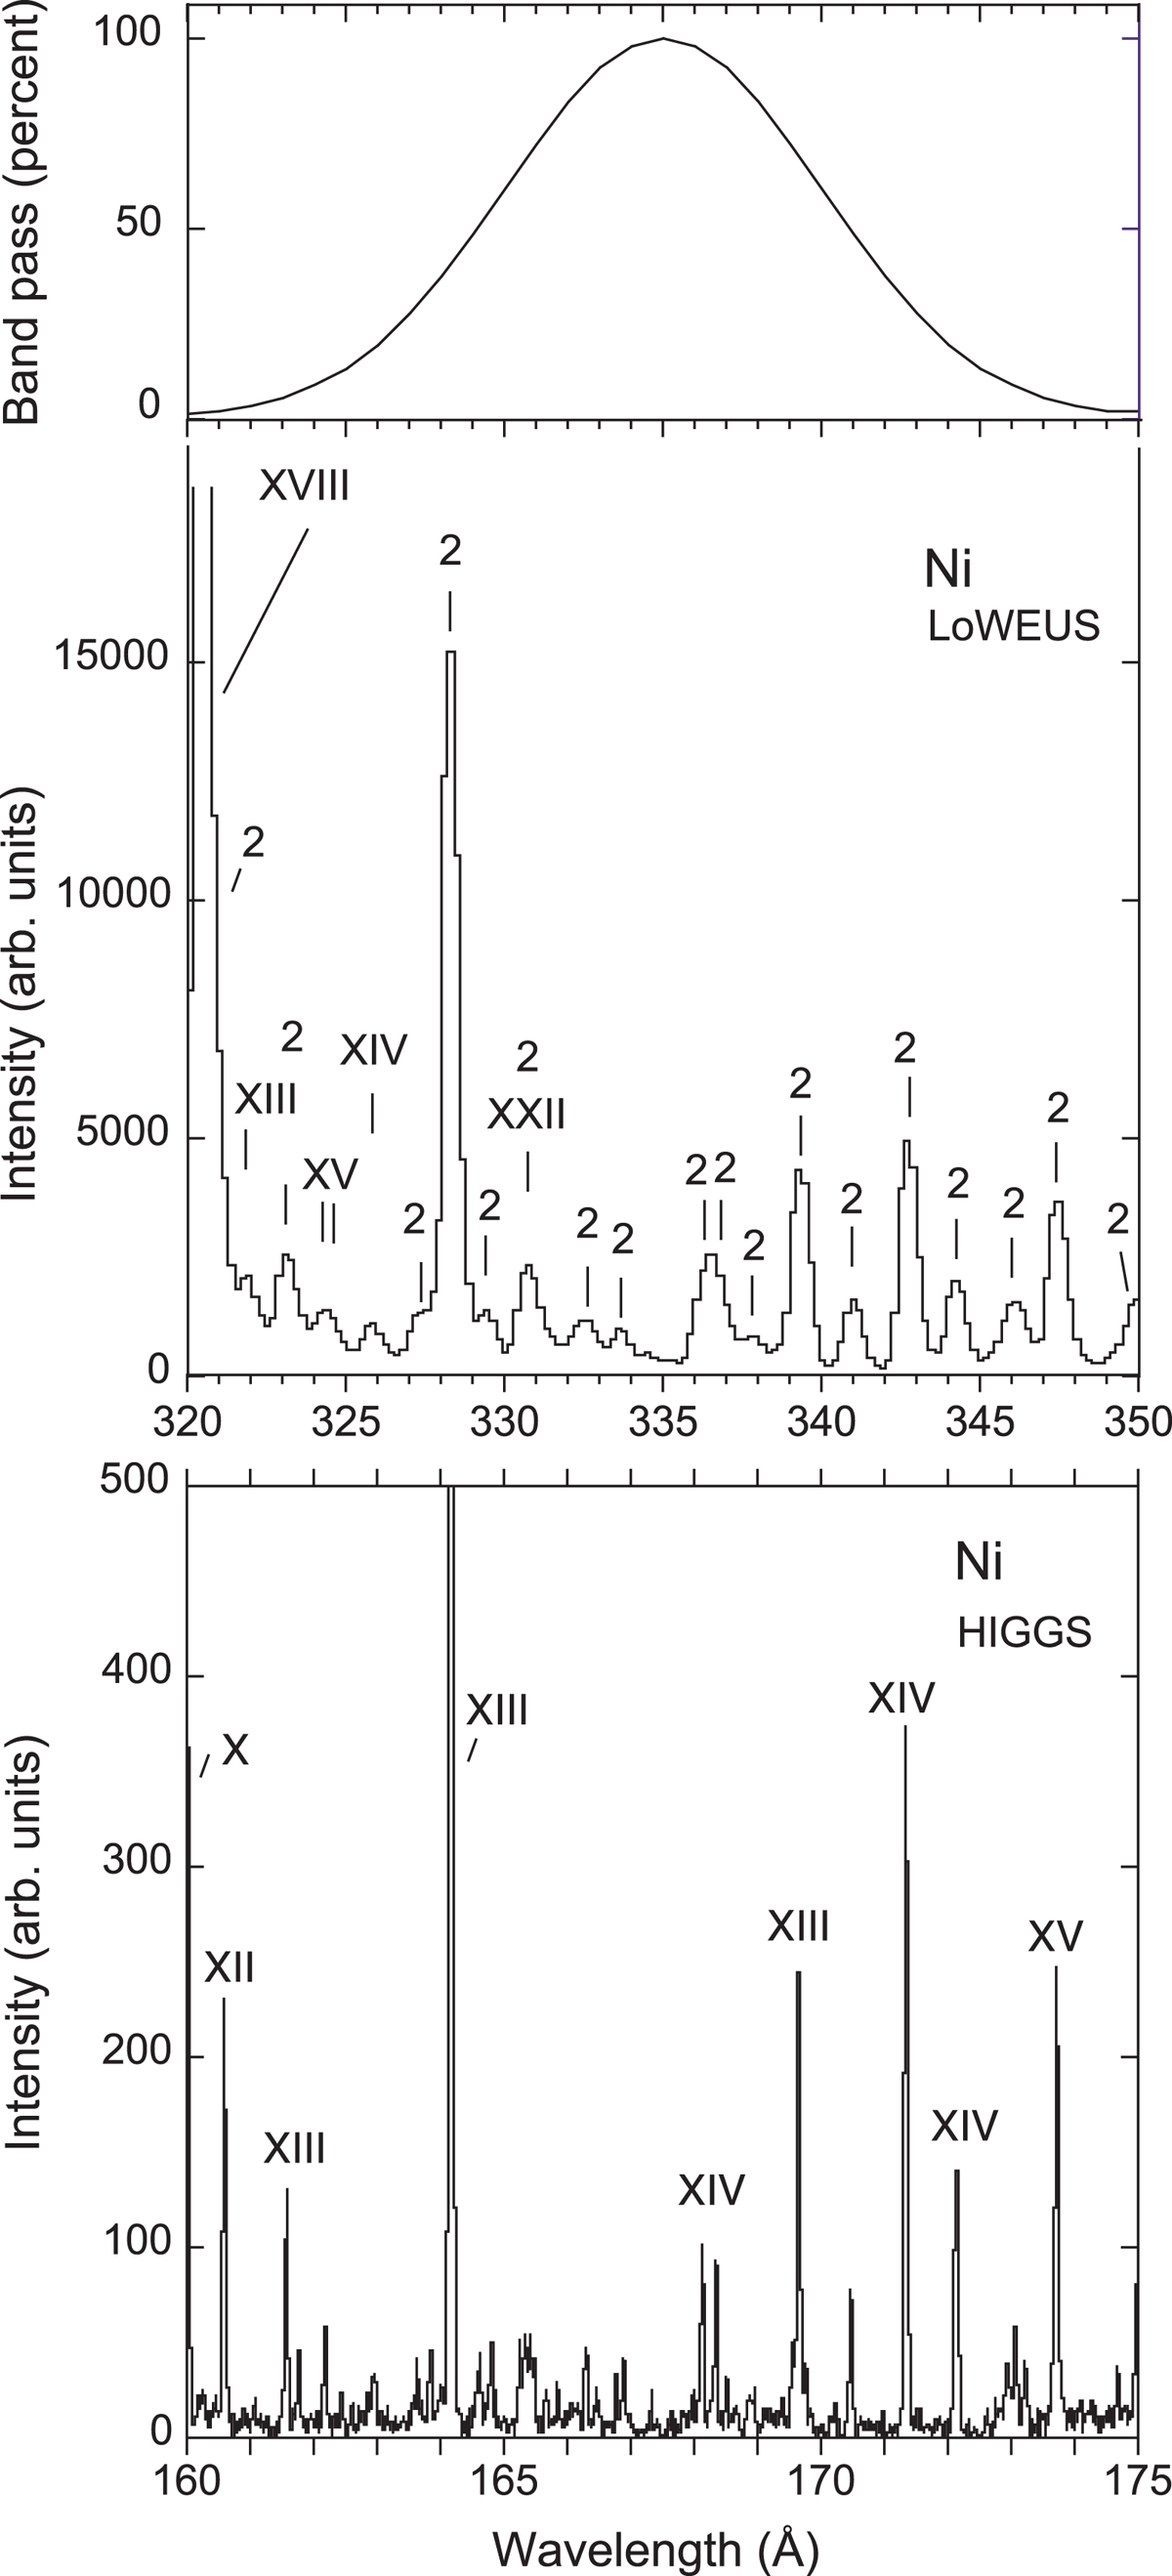
Spectrum of nickel in the range λ320–λ350: the spectrum in the middle panel was recorded with our moderate-resolution LoWEUS spectrograph at the EBIT-I electron beam ion trap at an electron beam energy of 1000 eV. Lines indicated by “2” are recognized as second diffraction order images. Fiducial markers indicate the rich structure of the spectrum, without being complete. Only the strongest of the known lines are identified by the spectrum number. The approximate band pass function of the SDO/AIA λ335 channel is indicated in the top panel. The lowest panel of the figure shows a high-resolution spectrum at half the wavelength and the strongest lines are identified by spectrum number. Strong first-diffraction order lines in this spectrum may appear in second diffraction order in the spectrum in the middle panel.
Current usage metrics show cumulative count of Article Views (full-text article views including HTML views, PDF and ePub downloads, according to the available data) and Abstracts Views on Vision4Press platform.
Data correspond to usage on the plateform after 2015. The current usage metrics is available 48-96 hours after online publication and is updated daily on week days.
Initial download of the metrics may take a while.